Browser-Based Enterprise Risk Platform

Commodity exposure, P&L, margins, and risk
in one enterprise view.

Commodity prices move. Margins shift. Decisions can't wait for manual consolidation. TransRisk gives procurement, hedging, trading, finance, and leadership teams the real-time analytics to act before risk turns into loss.

Trusted by enterprises across 28+ countries Oil & Oilseeds Softs & Plantations FMCG Grains & Pulses Metals & Mining Energy & Petrochem Packaging Multi Commodity
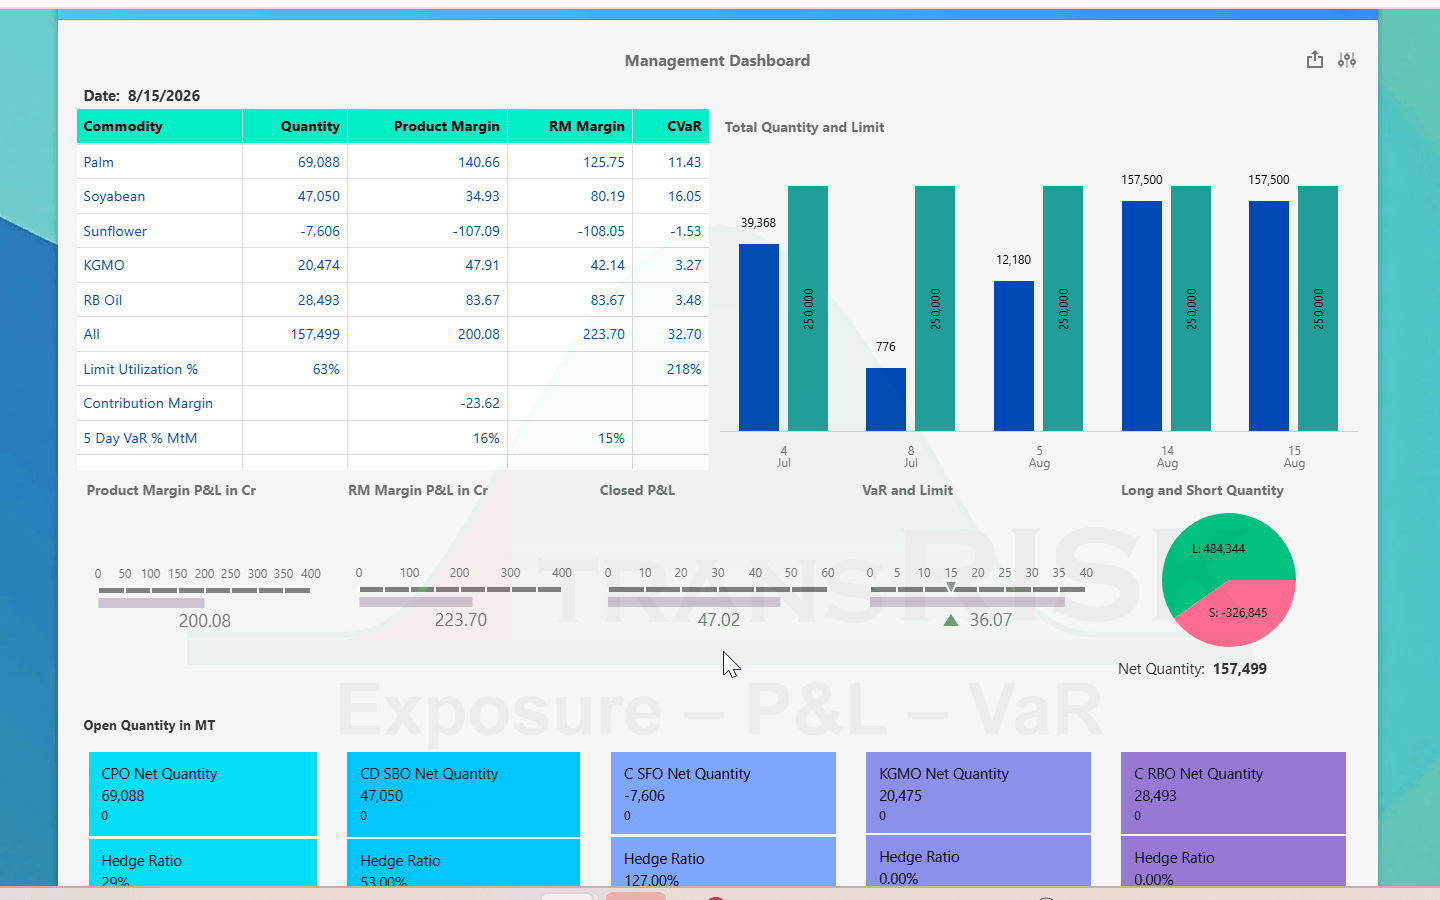
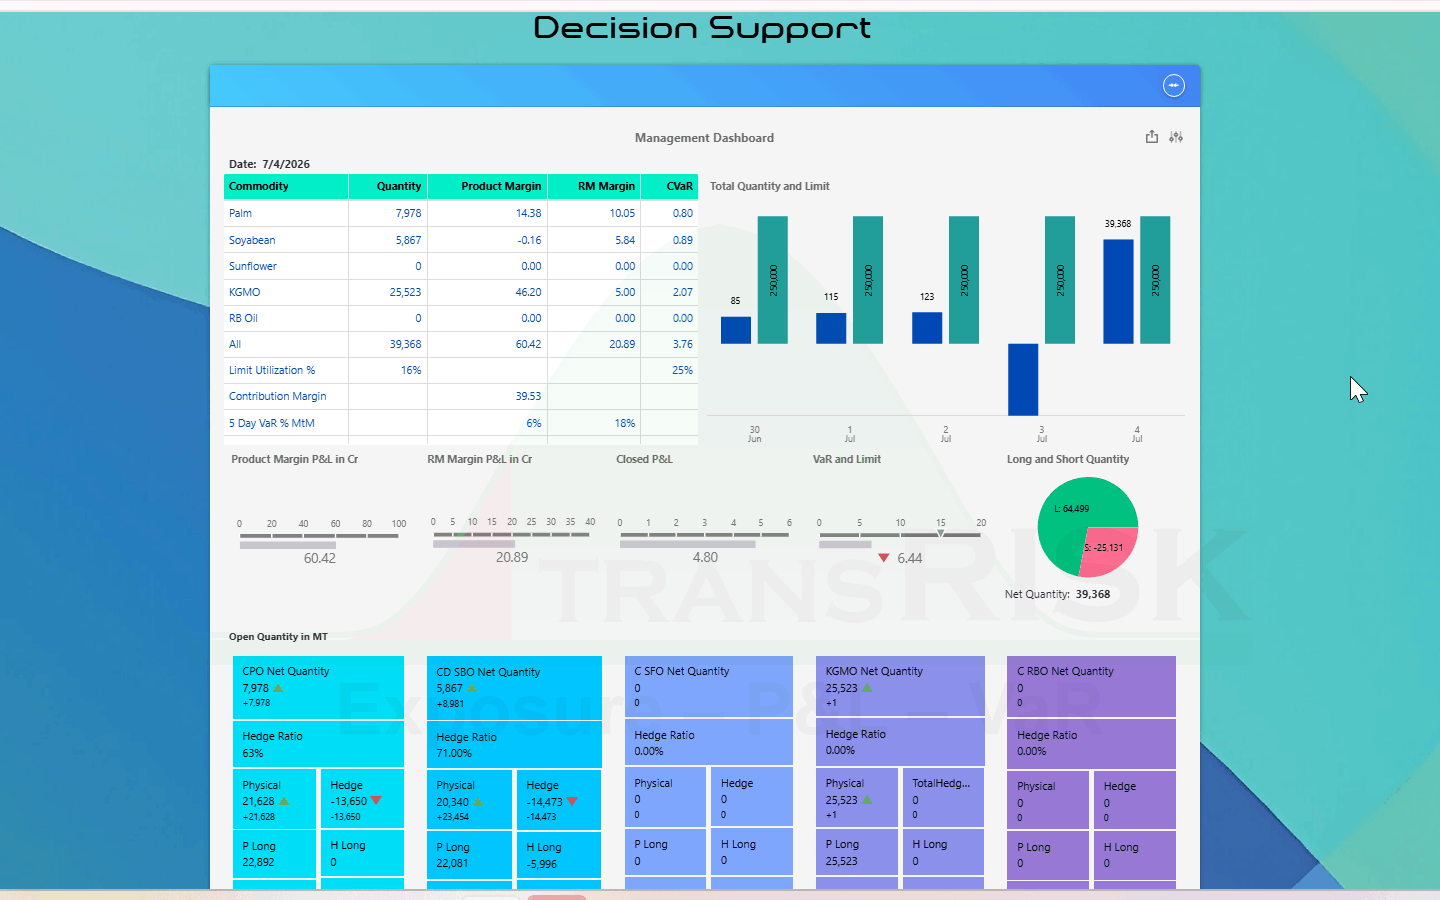
Management dashboard — quantity, product margin, raw material margin and CVaR per commodity, limit utilisation, five-day VaR against MtM, the long and short split, and open quantity with hedge ratio per position
Executive cockpit
Limit Breach
Copper exposure +8% over limit
Hedge Ratio
78% — 14 open positions
10
Algorithms
Owned by TransGraph
360°
Visibility across commodity,
plant, and market
4
Automated P&L
measures daily
2010
TransRisk go-live
Commodity risk since 2003

THE PROBLEM

Your systems of record were never built for decision support.

Exposure, P&L, margin and risk on open positions are commercial questions, not accounting outputs. ERP and CTRM systems answer to the ledger; spreadsheets answer to whoever built them. Neither leaves commodity teams with a number they can act on with confidence.

THE GAP

Decision support isn’t a native ERP/CTRM function

Procurement, trading, and marketing teams need day-to-day visibility into net exposure, MtM P&L, business margins, and market risk on open quantity — the numbers that actually drive commercial decisions. ERP and CTRM systems are built to satisfy accounting standards and internal SOPs, not this kind of decision support, so the need goes unmet at the source system.
THE WORKAROUND

Spreadsheets fill the gap — at the cost of accuracy and continuity

To bridge that gap, teams fall back on spreadsheets. This creates heavy dependency on specific individuals who maintain the models, and every manual step — data pulls, formulas, rollovers — is a fresh opportunity for error, right when the numbers need to be trusted most.

THE REQUIREMENT

Decision-support views demand special treatment, not altered books

Getting to net exposure, MtM P&L, margins, and open-position risk requires distinct handling of inventory, purchases, sales, and hedges — including complex activities like transfer pricing to isolate specific P&L metrics — all without touching the underlying accounting positions. Neither ERP nor spreadsheets are built to do this safely or repeatably.

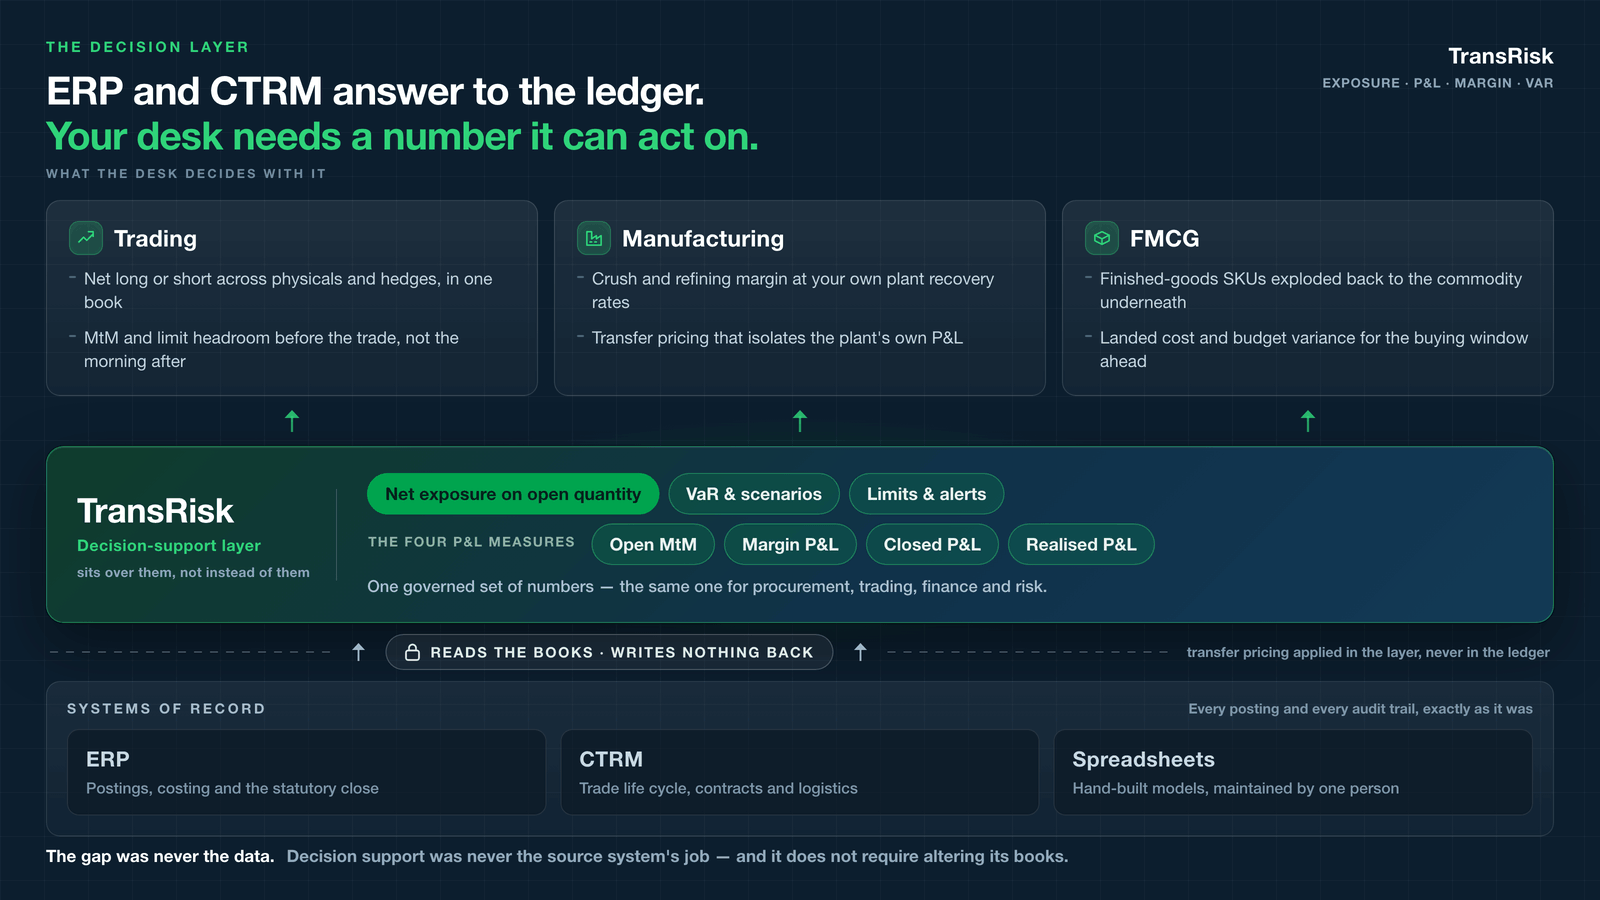
Layered diagram headed “ERP and CTRM answer to the ledger. Your desk needs a number it can act on.” At the bottom, the systems of record — ERP for postings, costing and the statutory close; CTRM for trade life cycle, contracts and logistics; spreadsheets as hand-built models maintained by one person — are marked unchanged. Above them a read-only boundary reads the books and writes nothing back, with transfer pricing applied in the layer rather than the ledger. Above that the TransRisk decision-support layer carries net exposure on open quantity, VaR and scenarios, limits and alerts, and the four P&L measures: Open MtM, Margin P&L, Closed P&L and Realised P&L. It feeds three desks: trading gets net long or short across physicals and hedges with MtM and limit headroom before the trade; manufacturing gets crush and refining margin at its own plant recovery rates with transfer pricing that isolates the plant’s P&L; FMCG gets finished-goods SKUs exploded back to the commodity with landed cost and budget variance for the buying window
ERP and CTRM answer to the ledger; the decision-support layer answers the commercial question — net exposure on open quantity, the four P&L measures, margin and risk — reading the books without altering them
What TransRisk Delivers

Native Decision Support

Net exposure, MtM P&L and margins calculated as first-class views, not derived after the fact.

Parallel Position Treatment

Inventory, purchases, sales and hedges modelled as teams need — without altering ERP books.

Built-in Transfer Pricing

Transfer-pricing logic runs natively to isolate and monitor specific P&L metrics.

Zero-Dependency Numbers

Exposure and P&L generated automatically every day — no single spreadsheet owner.

Full Audit Trail

Every calibration, treatment and adjustment logged for a traceable record.

THE PLATFORM

Everything you need to manage commodity risk
— in one platform

Six integrated modules. No spreadsheets. No manual reconciliation.

Module 1 of 6

Exposure Management

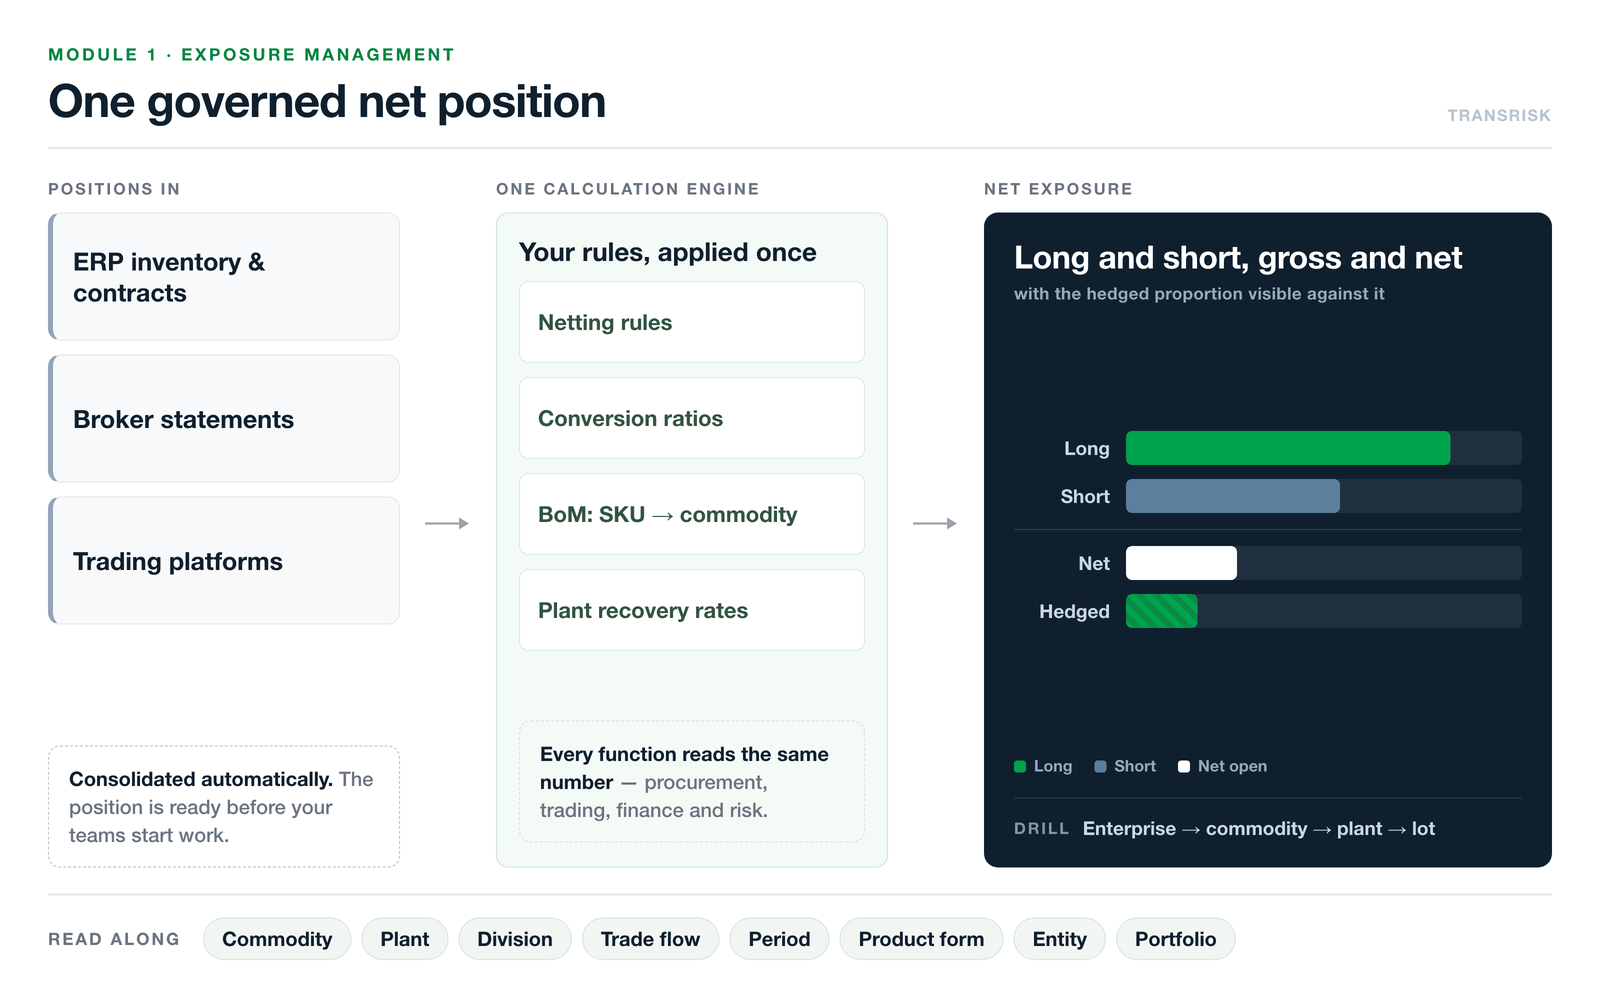
One governed net position across every plant, product, entity and portfolio — consolidated automatically from ERP, broker and trading data.

Explore the module
Exposure Management diagram: positions from ERP inventory and contracts, broker statements and trading platforms pass through one calculation engine — netting rules, conversion ratios, bill-of-materials SKU-to-commodity explosion and plant recovery rates — into one governed net position showing long, short, net and hedged, readable by commodity, plant, division, trade flow, period, product form, entity or portfolio
Exposure Management

Module 2 of 6

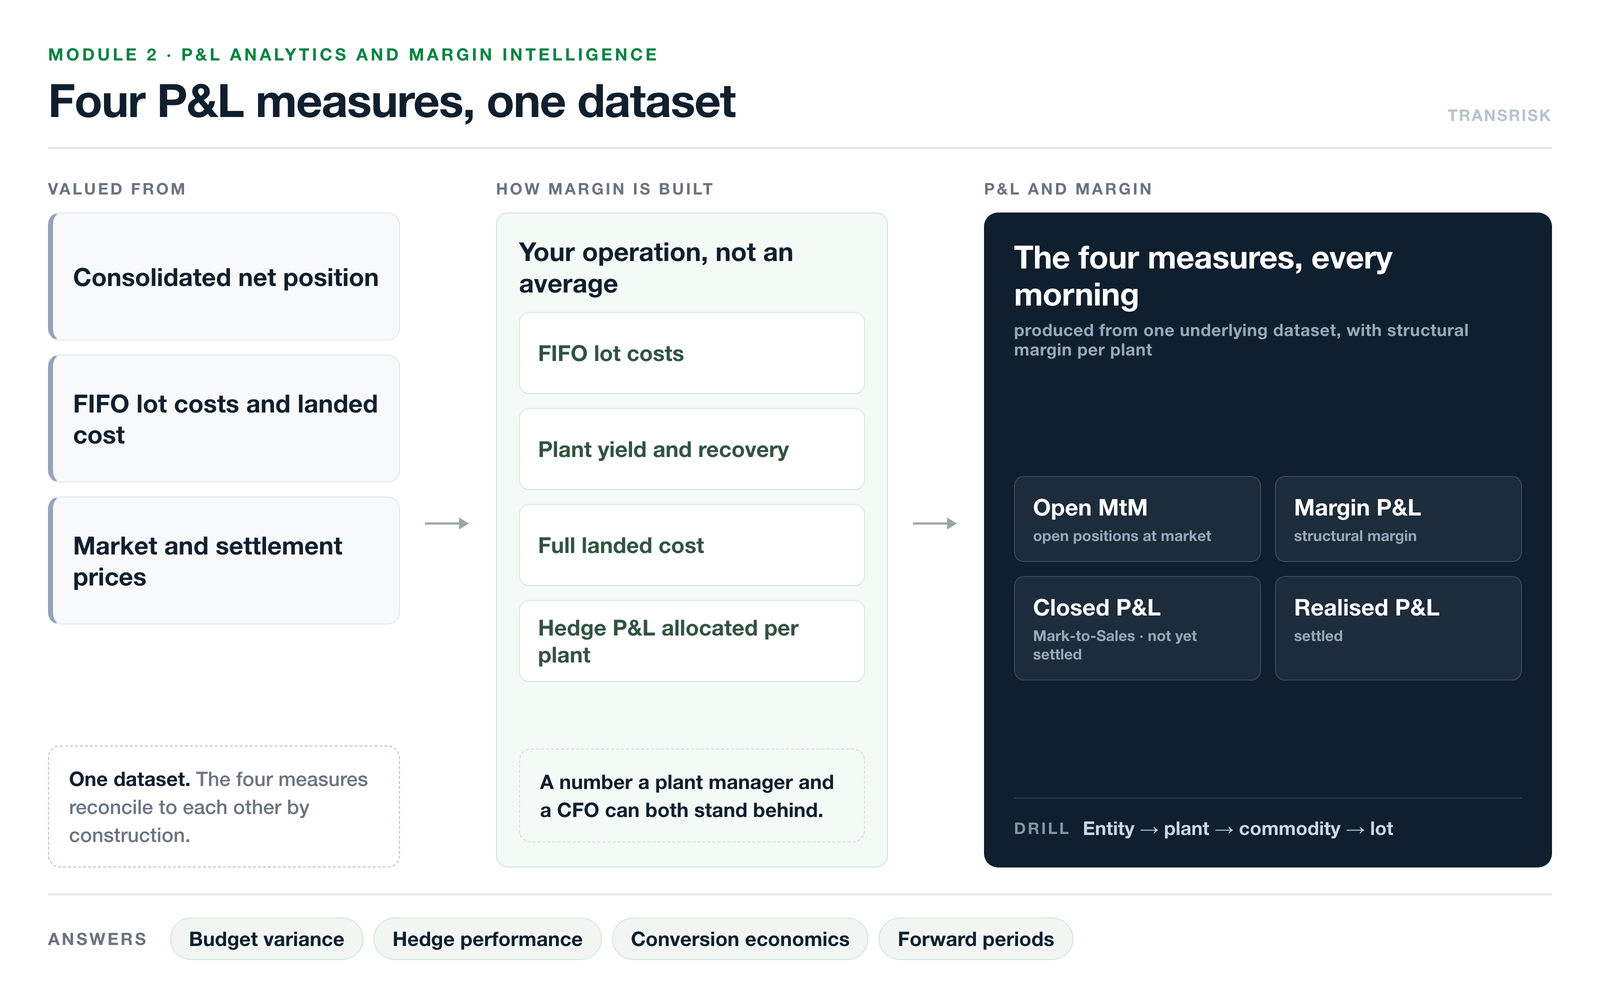
P&L Analytics and Margin Intelligence

Four P&L views automatically: Open MtM · Margin P&L · Closed P&L · Realised P&L — plus structural margin per plant. No manual reconciliation.

Explore the module
P&L Analytics and Margin Intelligence diagram: the consolidated net position, FIFO lot costs and landed cost, and market prices are valued by one engine applying plant yield and recovery and hedge P&L allocated per plant, producing the four measures — Open MtM, Margin P&L or structural margin, Closed P&L or Mark-to-Sales, and Realised P&L — drillable from entity to plant, commodity and lot
P&L Analytics and Margin Intelligence

Module 3 of 6

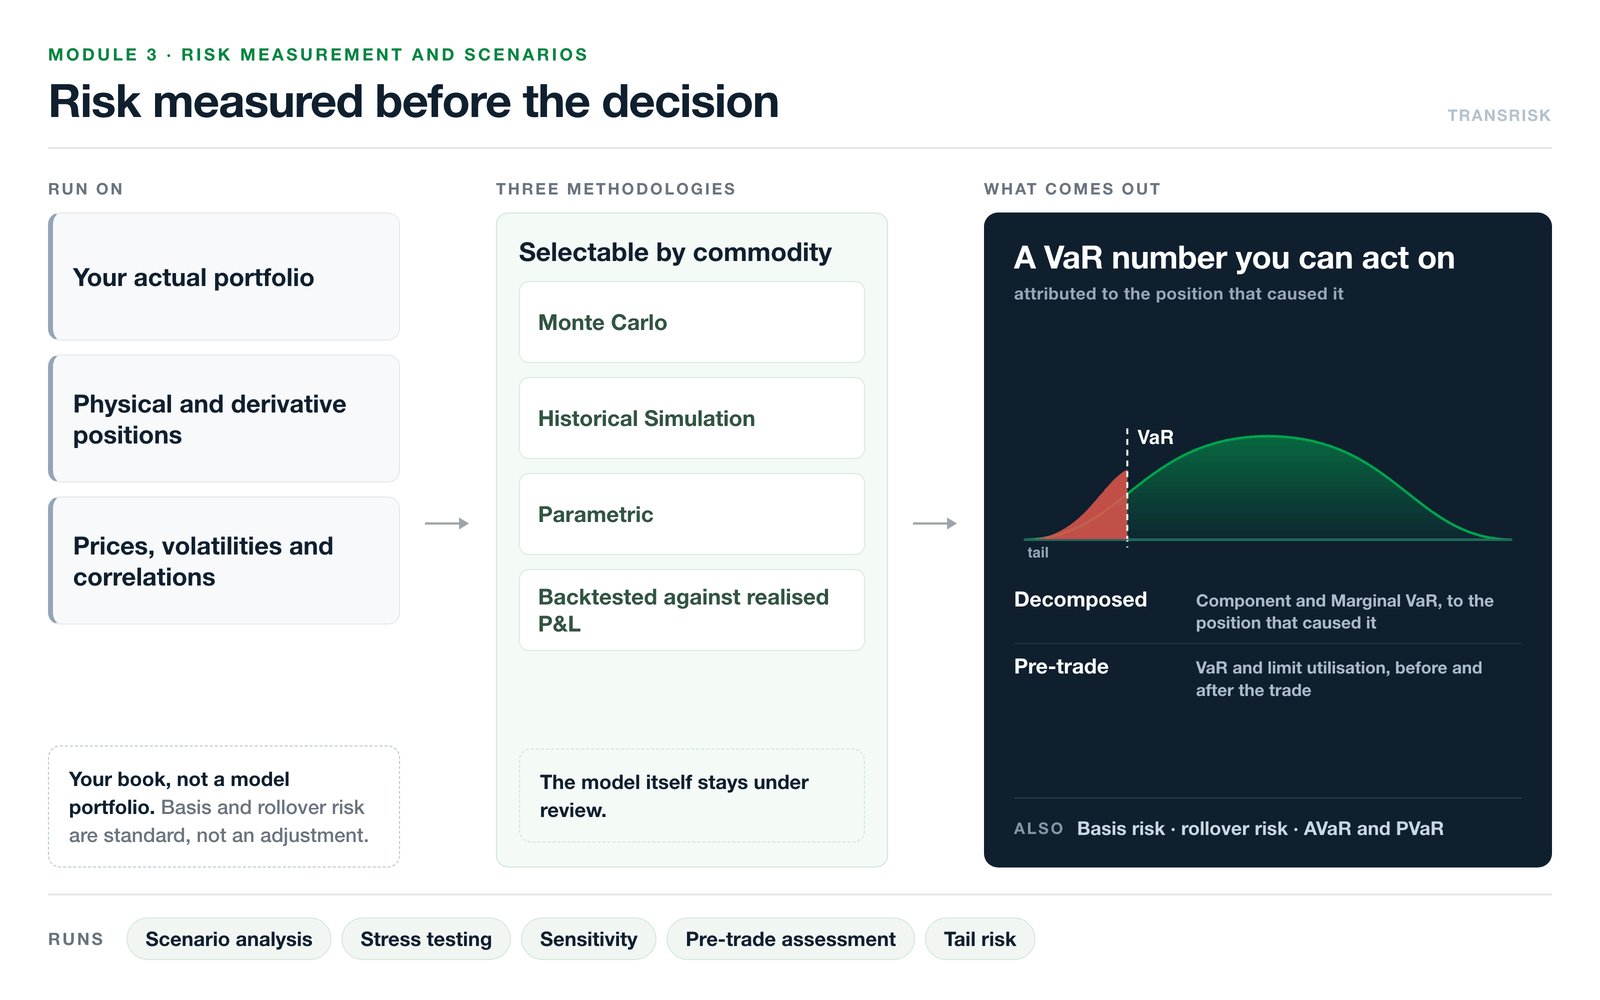
Risk Measurement and Scenarios

Monte Carlo, Historical Simulation and Parametric VaR, with scenarios, stress testing and pre-trade assessment on your actual book.

Explore the module
Risk Measurement and Scenarios diagram: the actual portfolio, its physical and derivative positions and market prices are run through three VaR methodologies — Monte Carlo, Historical Simulation and Parametric — backtested against realised P&L, producing a loss distribution with the VaR cut marked, Component and Marginal VaR decomposition and pre-trade assessment, alongside scenarios, stress testing, sensitivity and tail risk
Risk Measurement and Scenarios

Module 4 of 6

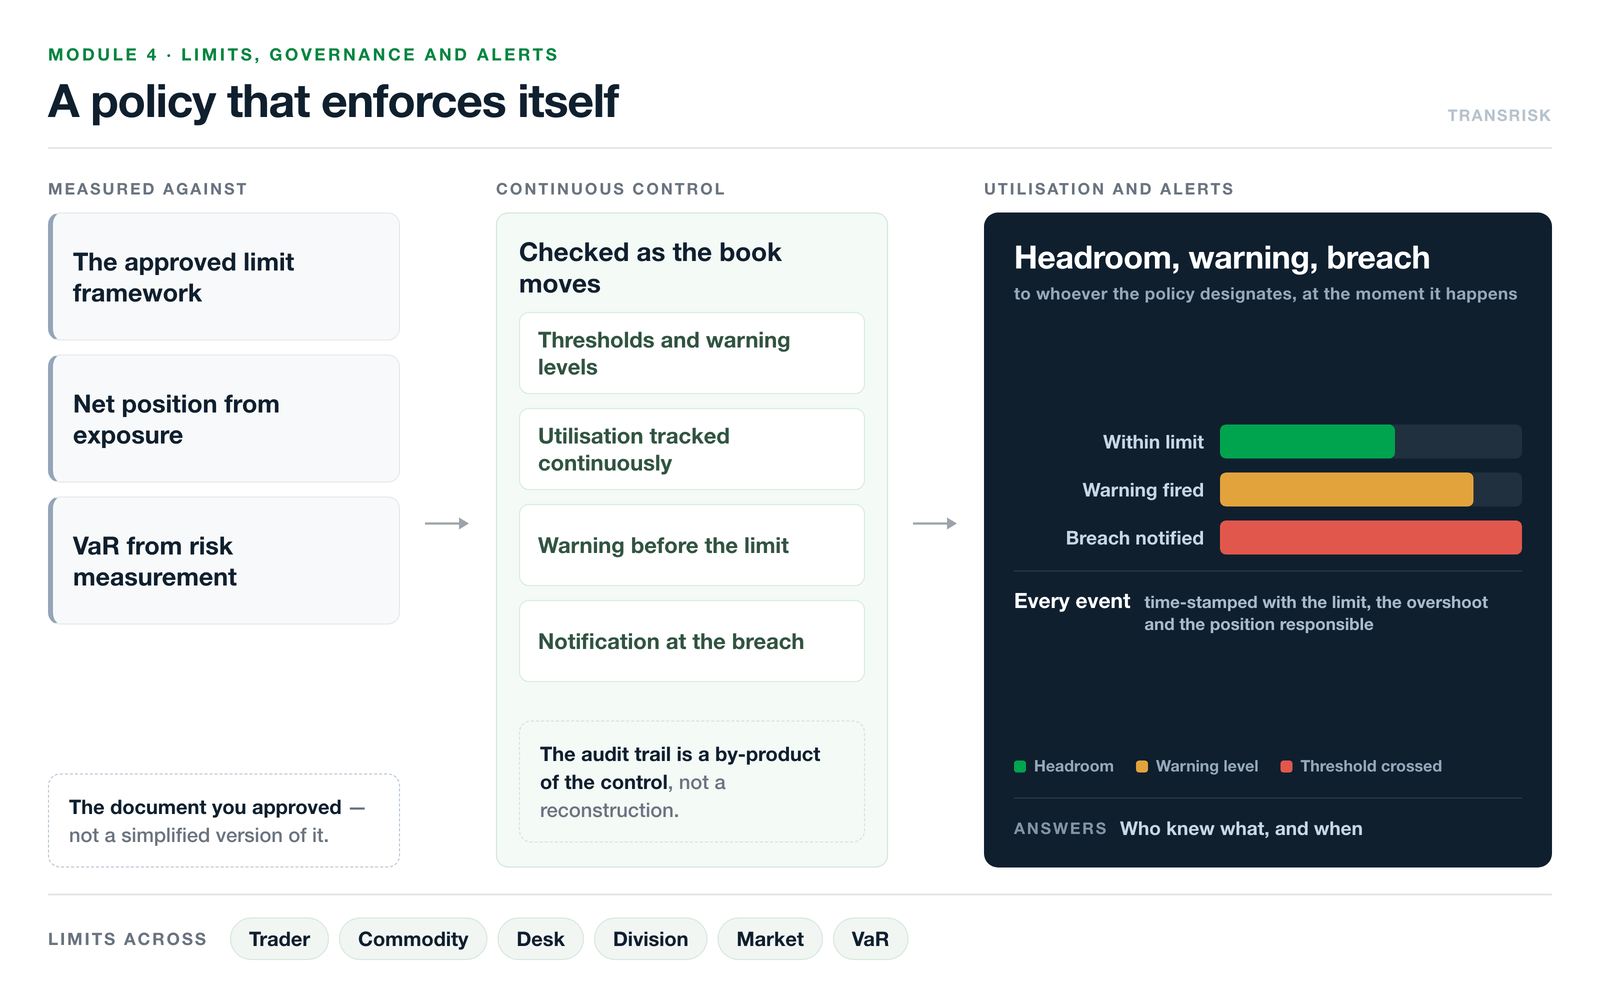
Limits, Governance and Alerts

Limits across trader, commodity, desk, division, market and VaR. Utilisation tracked continuously, warnings before the breach, audit trail throughout.

Explore the module
Limits, Governance and Alerts diagram: the approved limit framework, the net position and VaR are checked continuously against thresholds and warning levels, producing headroom within the limit, a warning before the limit is reached and a breach notification carrying the limit, the overshoot and the position responsible — limits set across trader, commodity, desk, division, market and VaR
Limits, Governance and Alerts

Module 5 of 6

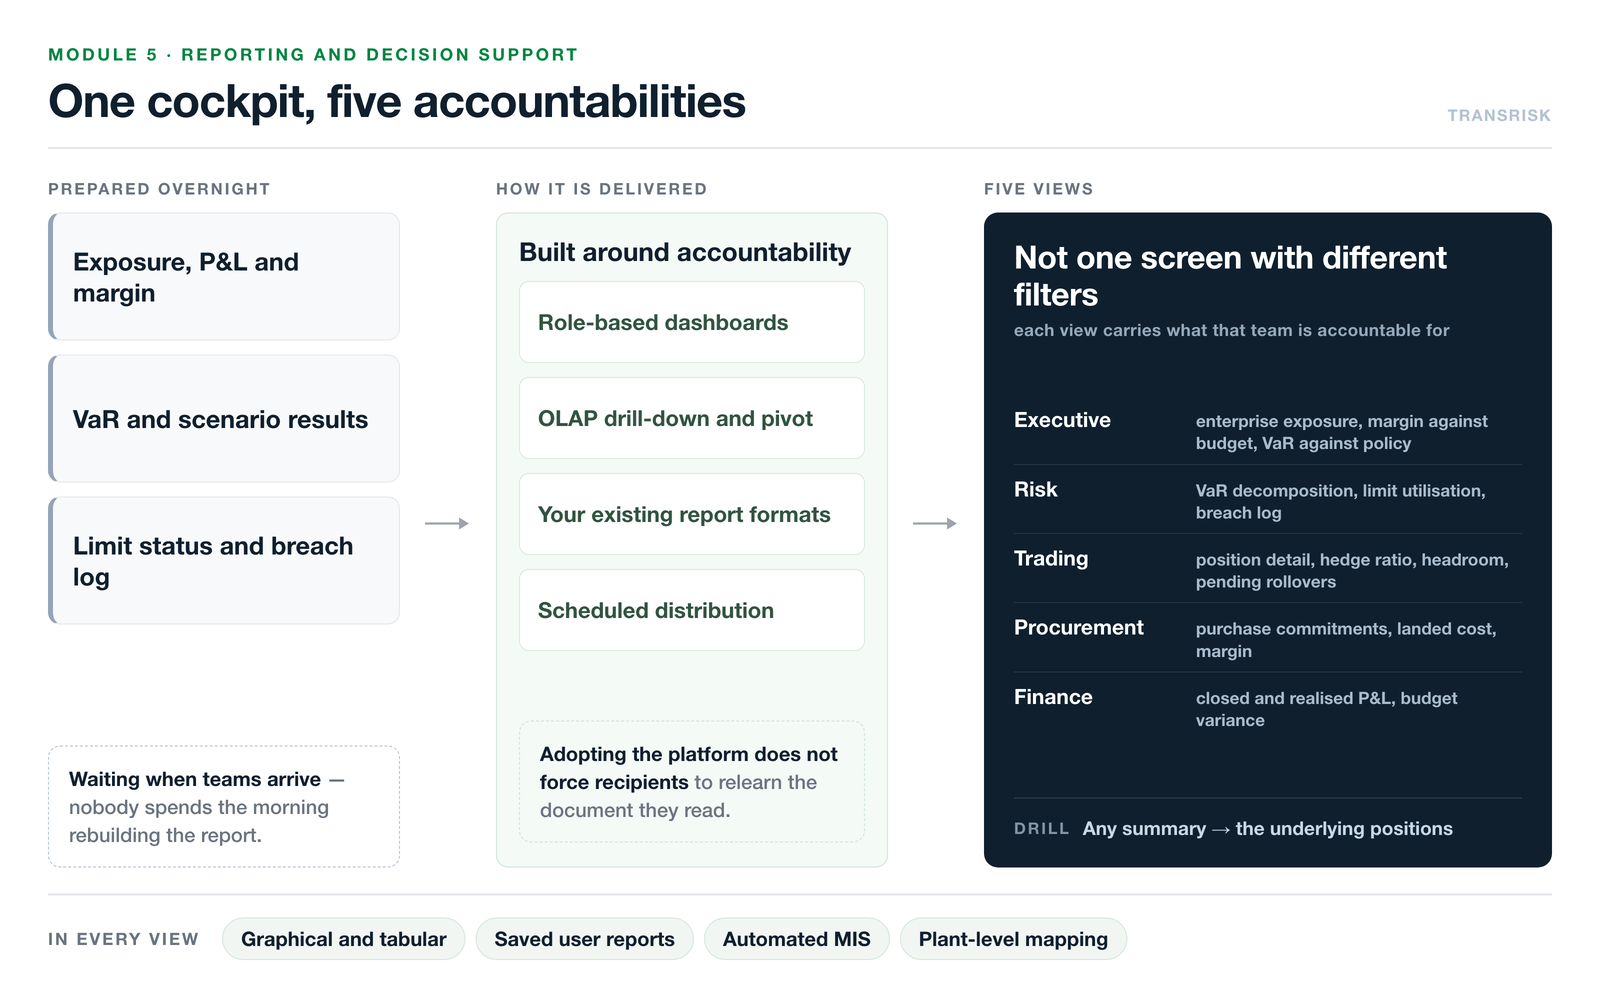
Reporting and Decision Support

Role-specific dashboards for executive, risk, trading, procurement and finance — with OLAP drill-down, custom reports and automated distribution.

Explore the module
Reporting and Decision Support diagram: exposure, P&L and margin, VaR and scenario results and limit status are prepared overnight and delivered as role-based dashboards with OLAP drill-down, existing report formats and scheduled distribution — five views for executive, risk, trading, procurement and finance, each carrying what that team is accountable for
Reporting and Decision Support

Module 6 of 6

Data and Integrations

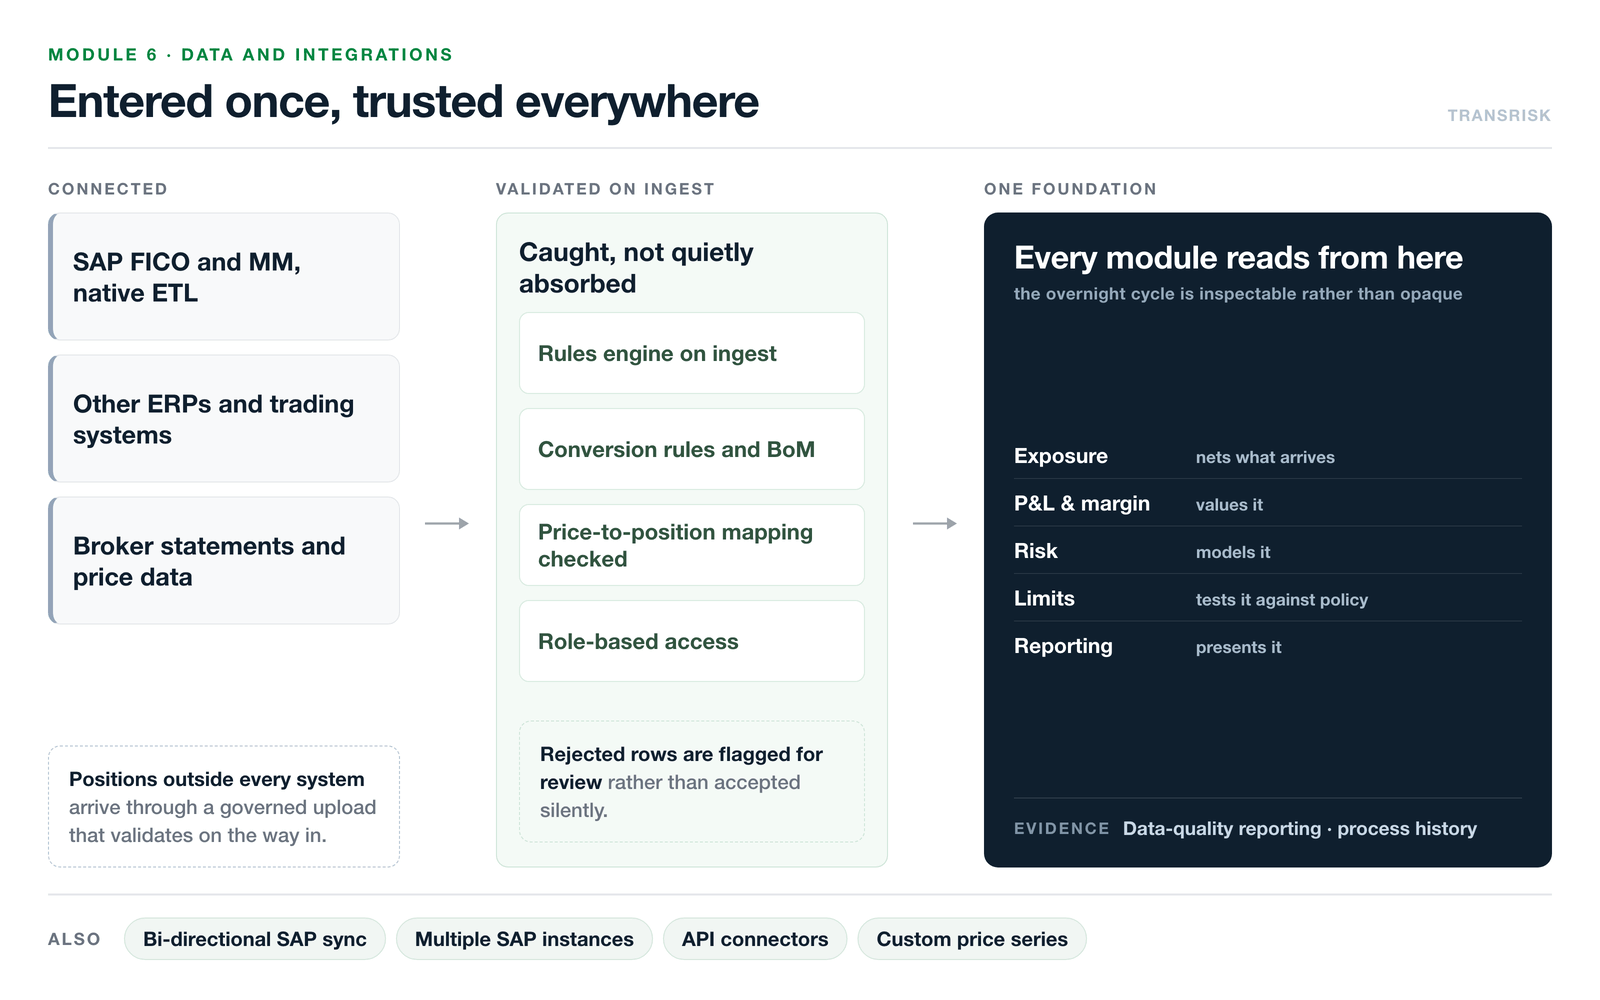
Native SAP FICO and MM ETL, ERP and trading-system pipelines, broker statement standardisation and validated price data. Your teams stop re-entering it.

Explore the module
Data and Integrations diagram: SAP FICO and MM through native ETL, other ERPs and trading systems, and broker statements and price data are validated on ingest by a rules engine with conversion rules, bill-of-materials definitions, checked price-to-position mapping and role-based access, giving one foundation that exposure, P&L and margin, risk, limits and reporting all read from
Data and Integrations

DESIGNED FOR YOUR TEAM

Built for every commodity decision-maker.

TransRisk serves the teams that carry operational accountability for commodity exposure — not just the risk function.

Procurement

Improve buying timing using margin analysis, basis risk assessment, and hedge-performance visibility. Make procurement decisions grounded in data, not market instinct.

Trading Desk

See real-time positions across physicals and derivatives. Assess risk before execution and act faster within defined limit constraints — with the full risk picture already visible.

Risk Management

Monitor exposures, limits, stress scenarios, and policy breaches in one place. Set and enforce multi-dimensional limits with automated alerts on utilisation and breach.

Finance / CFO

Improve P&L transparency, reporting accuracy, and cash-flow visibility. One source of truth for management reporting and board-level commodity risk updates.

Executive / CXO

Get a dashboard view of exposures, margins, risk, and limit utilisation — by commodity, plant, and position status. Replace manual weekly decks with live, auditable data.

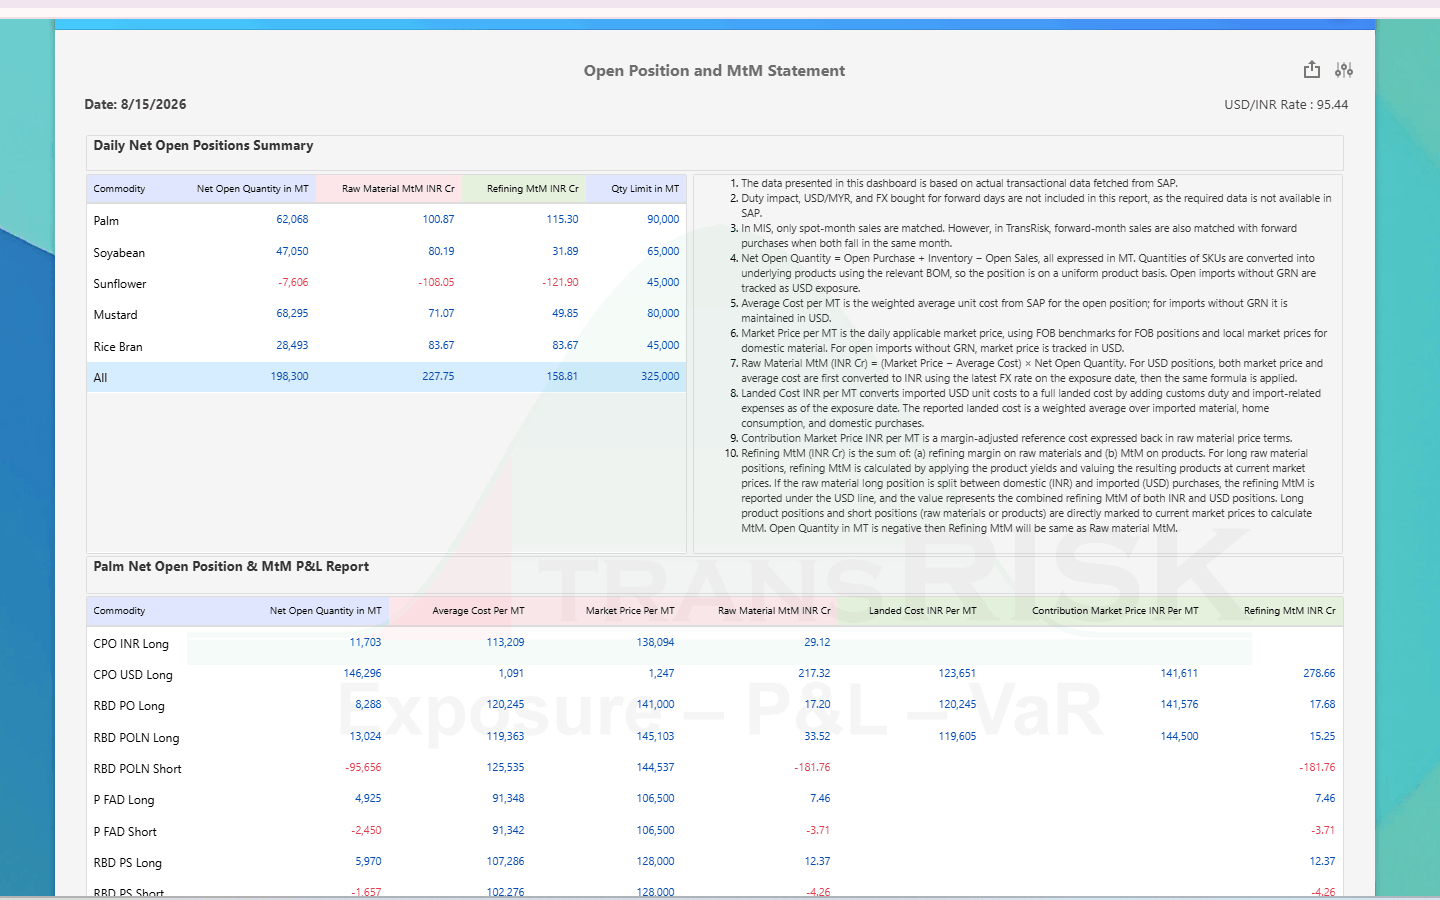
Open Position and MtM Statement — daily net open position per commodity against its quantity limit, over a per-position report giving average cost, market price, landed cost and contribution market price per MT
Executive dashboard — enterprise exposure summary, margin vs budget, VaR against policy
2003 Commodity domain expertise since
150+ Large MNC clients
28+ Countries served
8 Industries covered

WHAT CLIENTS SAY

Decisions made with confidence, not guesswork.

Companies running commodity risk on TransRisk share one thing in common: they stopped managing risk in hindsight. Here is what that shift looks like in practice.

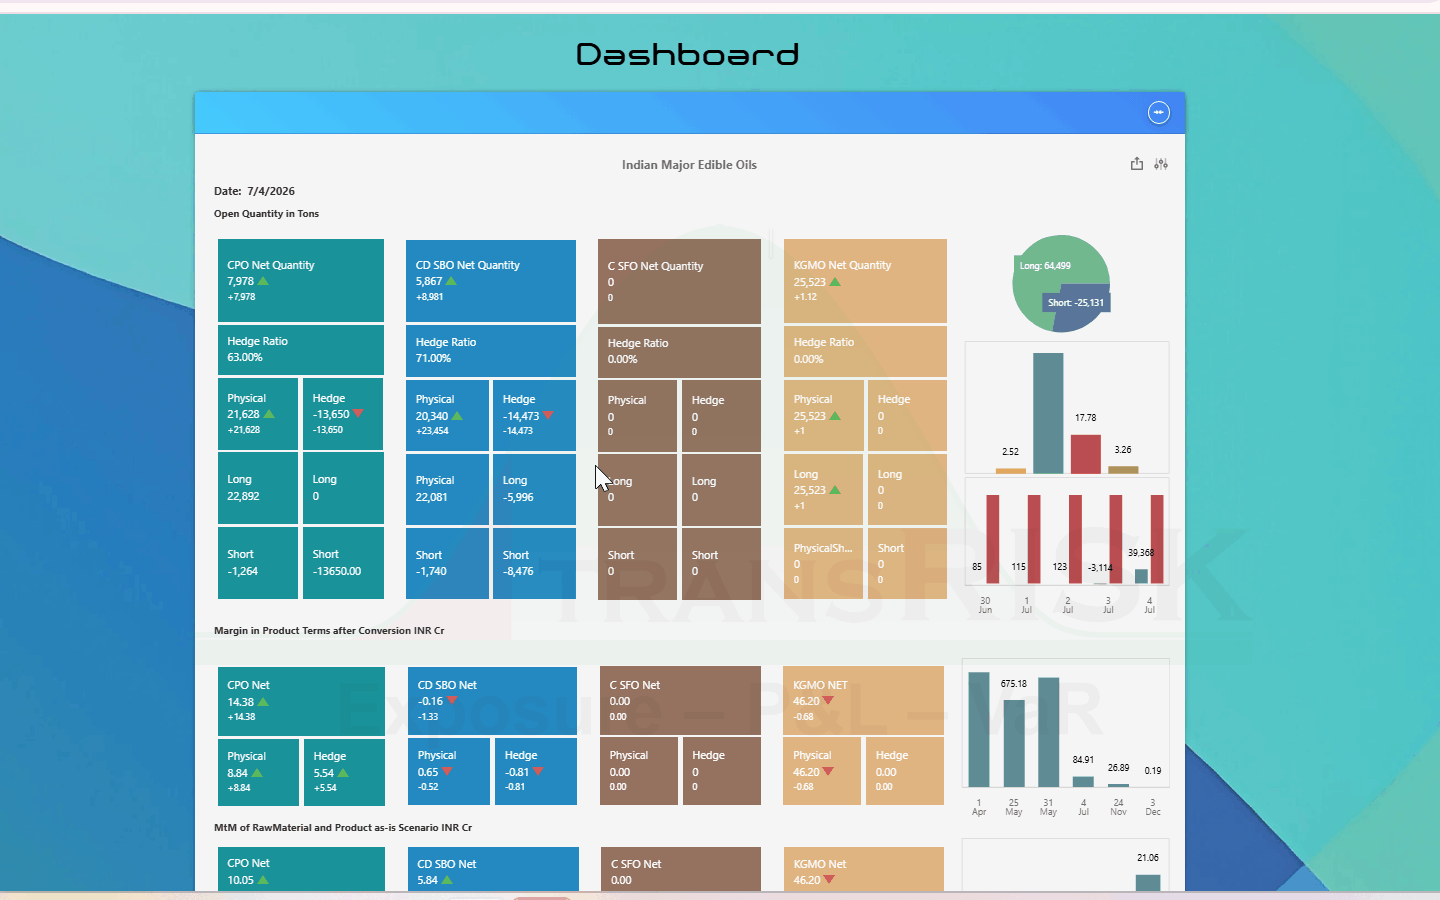
  • Palm refining margin by plant — CPO quantity and price carried through refining cost, P FAD and RBD PO recovery percentages and process loss into refining, raw material, closed sales, local replacement and import replacement margin per MT

    Vegetable oil market dynamics · Advisory partnership

    We have engaged TransGraph as our partner in assessing vegetable oil market dynamics. TransGraph consulting has been instrumental in the journey and relationship we have built over the past 5 years. Insightful, analytical, and responsive are few qualities to name. We are pleased with the collaboration, dedication and consultation provided to us by TransGraph. It is great pleasure to work together with TransGraph and I wish them continued success.

    CEO

    Wings Group

  • Aluminium procurement analytics — annual budget against procured and open tonnage, average purchase price against budget, realised saving and MtM against market, with budget consumption and coverage build-up by delivery month

    Procurement advisory · Aluminium price volatility

    We have engaged TransGraph as our trusted Procurement and Risk Management Advisor for the past two years relying on their invaluable insights and data driven solutions to navigate the complexities of Aluminum Price volatility. Their prompt engagement and dedication to excellence have been the key factors in our successful Partnership.

    Sr. Vice President

    NCC Ltd

  • P&L Analytics pivot — Closed and Realised quantity and P&L by commodity, each status shown separately and reconciling to an all-statuses total

    P&L and margin insight · Automated limits

    TransRisk provides deeper insights into P&L, refining and replacement margins, and exposure for main commodities and by-products. The ability to convert broker statements into positions, simulate risk scenarios, and apply automated limits has enabled quicker and more transparent reporting at all levels.

    Vice President

    Top Edible Oil Trading Company in India

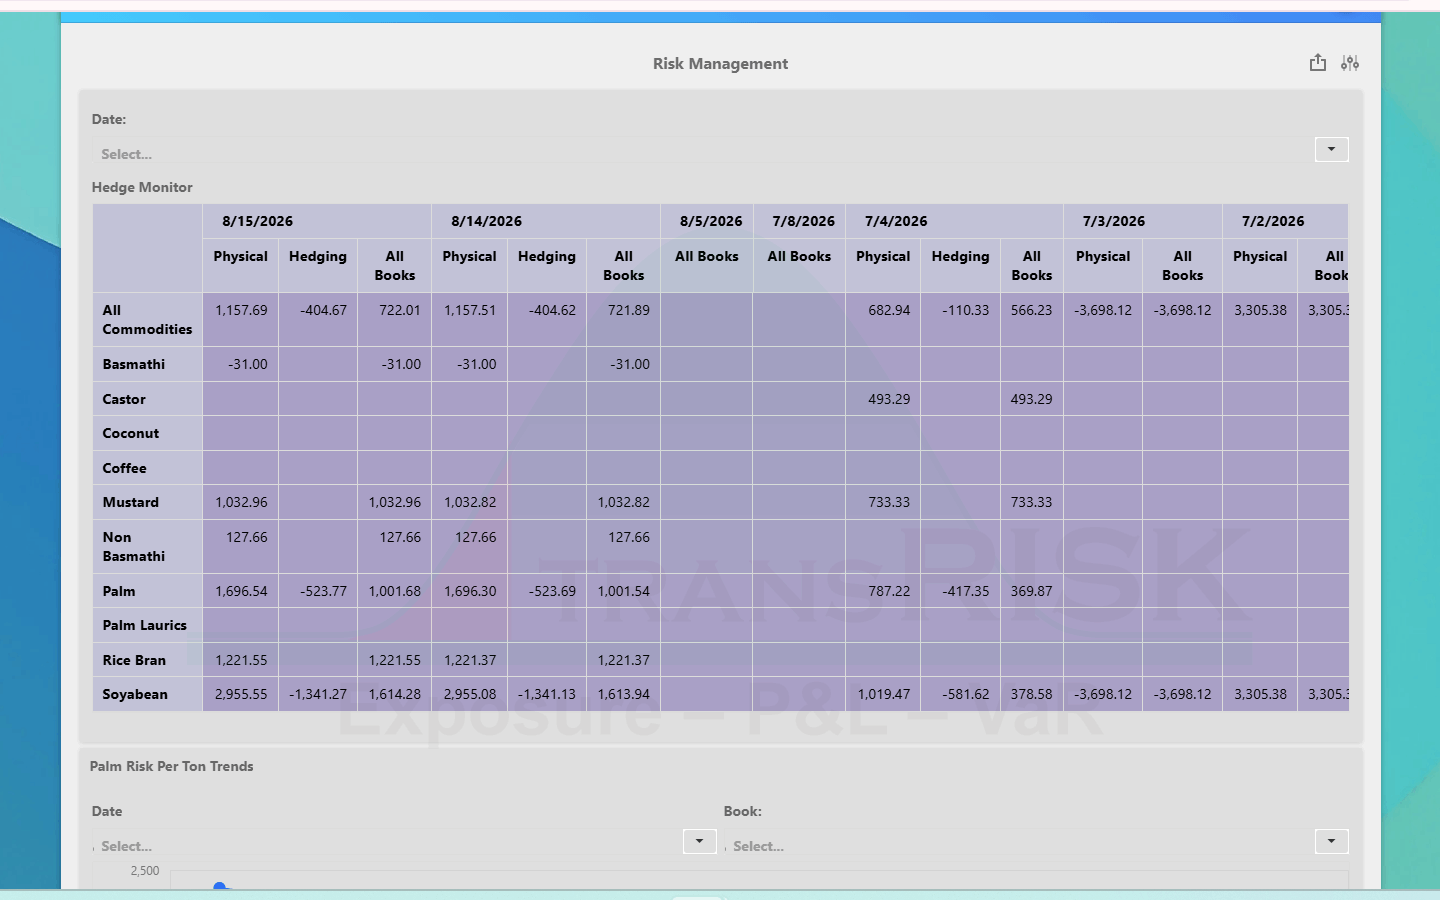
  • Risk management hedge monitor — physical, hedging and all-books risk per commodity across successive reporting dates, over a per-tonne risk trend for the selected commodity

    Support experience · Solution-oriented delivery

    TransRisk has consistently provided a knowledgeable and hardworking team with strong functional and technical capabilities. Their promptness, professionalism, and solution-oriented approach have made the overall support experience highly dependable. The team is attentive to detail and works closely with us to develop practical, workable solutions to process-related challenges.

    CRO

    Indian Edible oil & FMCG Player

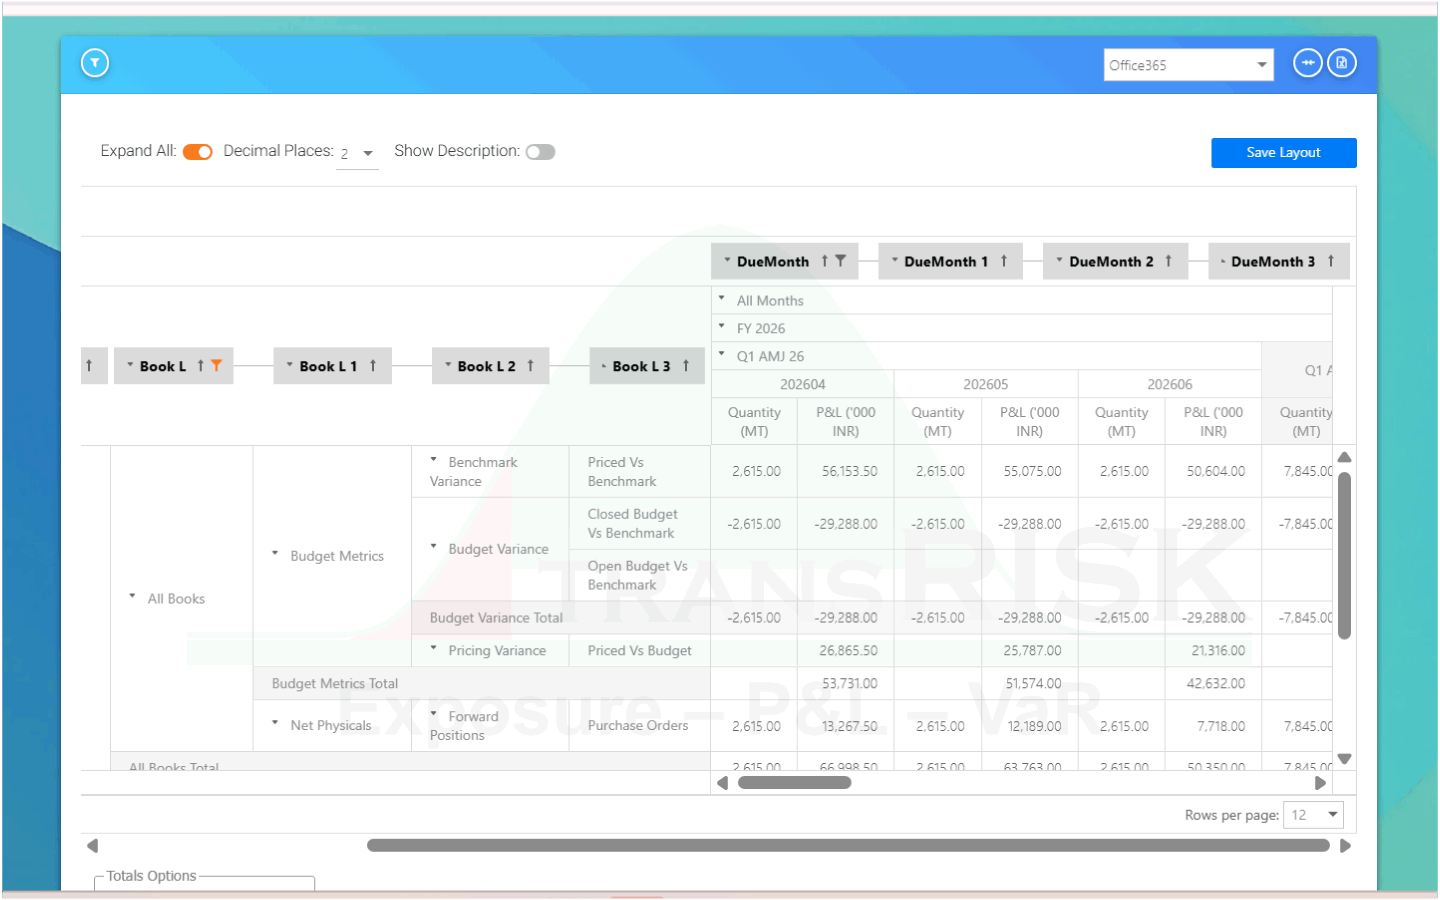
  • OLAP drill-down — measures and dimensions dragged into filter, row, column and data areas, with quantity, unit cost, market price and P&L pivoted by commodity

    Delivery collaboration · Responsive support

    Collaborating with the TransRisk team has been a highly effective and seamless experience. Their clear communication, professional approach, and well-organized workflow enabled us to align quickly on objectives and execute tasks efficiently. We sincerely appreciate the team’s responsiveness and professionalism, and look forward to working together again on future projects.

    Risk and Reporting Head

    Singapore-based Agri Trading and Manufacturing Giant

IN PRACTICE, TRANSRISK CLIENTS REPORT

1

Forward-looking risk replaces post-mortem analysis — limits managed before they breach, not explained after.

2

Pricing and procurement decisions made against quantifiable, pre-agreed risk thresholds — not gut feel.

3

Daily P&L and margin reports generated automatically — no manual assembly before each morning’s review.

4

One platform serves procurement, trading, risk, finance, and the C-suite — no tool proliferation, no version conflicts.

See TransRisk in your context.

Every demo is scoped to your commodity, your P&L structure, and your current reporting workflow. You leave with a working prototype — not a slide deck.

BUILT FOR YOUR INDUSTRY

TransRisk is configured for 8 commodity-intensive industries

Each demo edition is pre-loaded with the commodities and asset classes relevant to your sector.

Oil & Oilseeds

Palm, Soybean, Sunflower, Mustard, Coconut, Meals

Softs & Plantations

Natural Rubber, Sugar, Coffee, Cocoa, Dairy, Spices

FMCG & Consumer Goods

Vegetable oils, Sugar, Grains, Dairy, Packaging

Grains & Pulses

Wheat, Maize, Rice, Barley, Chana, Tur, Soymeal

Metals & Mining

Copper, Aluminium, Zinc, Lead, Nickel, Steel, Iron ore

Energy & Petrochemicals

Crude, Brent, WTI, Naphtha, Natural gas, Ethanol

Packaging – Paper & Polymers

Kraft paper, Duplex board, Pulp, HDPE, PP, PET

Multi Commodity

All major commodity groups across multiple entities

Don't see your industry? We configure TransRisk to your specific commodity portfolio.

Talk to an Expert

Built by commodity specialists.
Not adapted from generic software.

Most risk platforms are built by technology companies that learned commodities later. TransRisk is the opposite.

TransGraph Consulting has advised commodity-driven enterprises since 2003 on price forecasting, hedge model design, procurement strategy and risk policy. TransRisk is the software expression of that domain knowledge — purpose-built for physical commodity players, not adapted from a financial markets template.

Our risk consultants and development team are the same people. When a new hedge structure emerges in the market, it is in TransRisk within months — not years.

2003 since Commodity price & risk consulting
80+ analysts Dedicated commodity researchers
60+ commodities Across agri, metals, energy, packaging
150+ enterprises Across 8 industries

See what your exposure, P&L and risk look like in one place.

A 45-minute tailored session with our team. Pre-configured for your industry and asset classes. No generic demos.

Talk to an Expert Download Product Brochure
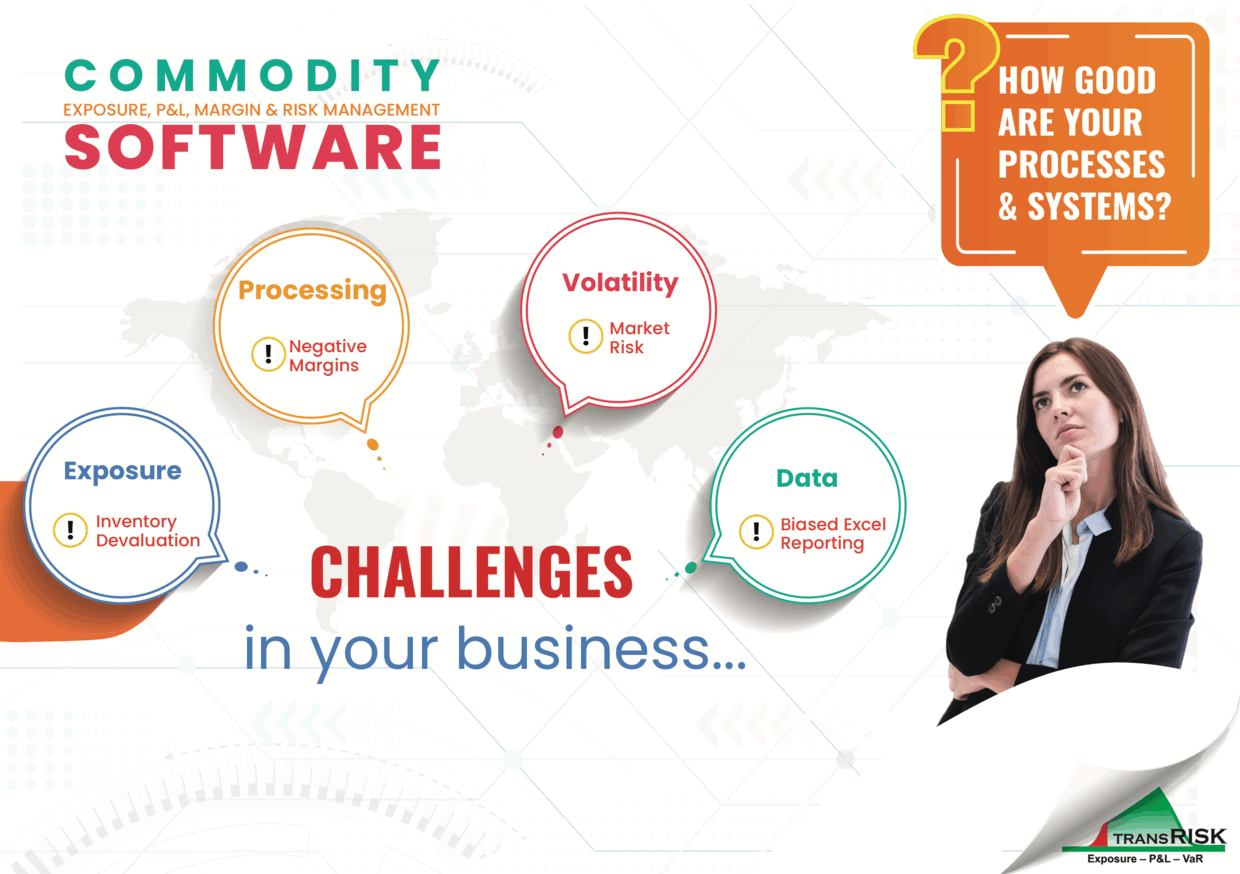
TransRisk product brochure cover — Commodity Software for exposure, P&L, margin and risk management, with four challenge callouts over a world map: inventory devaluation, negative margins, market risk and biased Excel reporting
TransRisk product brochure

No commitment required Configured for your commodities Available for all industries