THE PLATFORM

Exposure. P&L. Margins. Risk.
One platform, six modules.

Six integrated modules for exposure management, P&L and margin intelligence, risk measurement, governance, and decision support — running on one automated data layer.

Request a Demo
Exposure, P&L and risk across the platform — click any screen to expand

THE PLATFORM

One operating platform for commodity-exposed businesses.

TransRisk is a commodity exposure, P&L, margin and risk management platform built by TransGraph Consulting Pvt. Ltd. It consolidates physical and derivative positions from ERP systems, broker statements, and trading platforms into a single daily view of exposure, P&L, margin, and Value-at-Risk. It combines reporting, analytics, and governance into one operating platform for commodity-exposed businesses — helping teams understand what they are exposed to, how positions affect margins and P&L, and where risk limits are approaching or breached.

How the platform works

Data flows in automatically. Risk numbers and reports flow out.

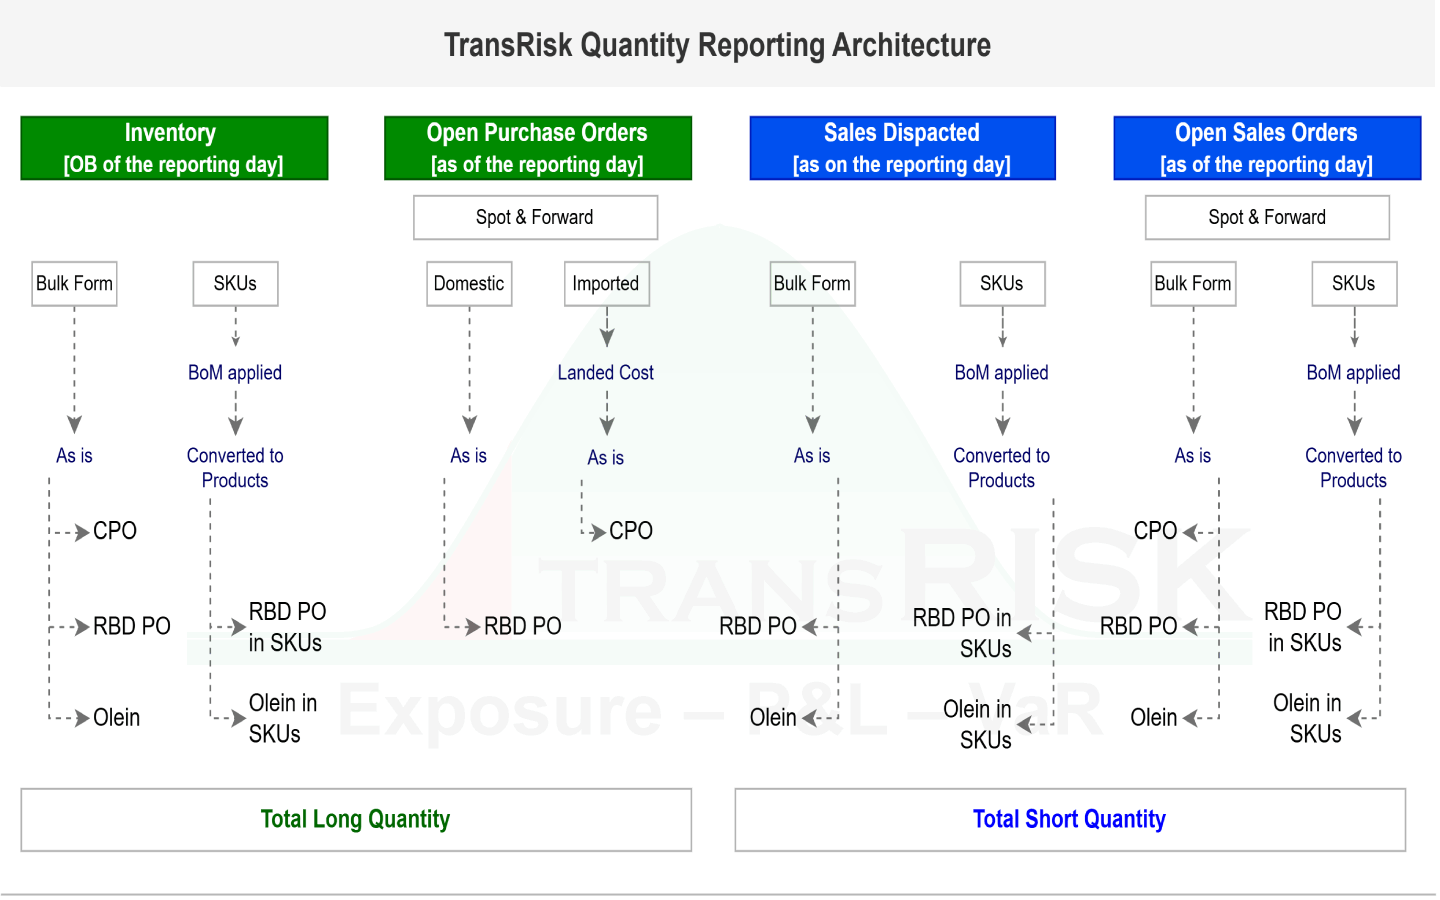
Quantity reporting architecture — inventory, open purchase orders, dispatched sales and open sales orders each split into bulk form and SKUs, SKUs converted through BoM into CPO, RBD PO and Olein, resolving into total long and total short quantity
The same data flow as an annotated diagram — click to expand

THE SIX MODULES

Six integrated modules

One data layer underneath all six. No spreadsheets, no manual reconciliation — each module feeds the next.

Module 1 of 6

Exposure Management

One accurate view of net commodity exposure across every plant, product, position, entity and portfolio.

See the deep dive

What it does

Exposure Management consolidates every physical and derivative position your business holds into a single governed net exposure — then lets you read that number along whichever dimension the decision requires: commodity, plant, division, trade flow, period, product form, entity or portfolio.

The business problem it addresses

In most commodity-exposed businesses the exposure picture is fragmented by department. Procurement tracks budgeted purchases in one spreadsheet, trading records hedges in another, and inventory sits in the ERP. Nobody holds the consolidated view, so decisions on hedging, pricing and procurement are taken on partial information. When two teams are asked the same question they return two different answers — and the disagreement is rarely arithmetic. Each team is netting a different set of positions against a different definition of exposure.

How it works

Positions flow in automatically from ERP systems, broker statements and trading platforms. One calculation engine applies your netting rules, your conversion ratios and your bill-of-materials mappings — exploding finished-goods SKUs back into their underlying commodity components, and resolving raw material into end product and by-product at your own plant recovery rates. The consolidated position is ready before your teams start work, and every function reads it the same way.

What you can see

Enterprise total down to commodity, plant and individual lot in a few clicks. Import, domestic and export books separated by trade flow. Near-term exposure separated from forward periods. Long and short shown gross as well as net, with the hedged proportion visible against each position.

Which teams use it

Procurement sizes the next purchase against what is already committed. Trading sees physicals and derivatives in one book before executing. Finance gets a position base that reconciles. Risk gets the denominator for every limit and every VaR run. Leadership gets one number rather than four versions of it.

How it relates to the other five modules

Exposure is the base layer. P&L Analytics and Margin Intelligence values these same positions; Risk Measurement and Scenarios runs VaR and stress tests over them; Limits, Governance and Alerts measures utilisation against them; Reporting and Decision Support presents them; and Data and Integrations is what keeps them current.
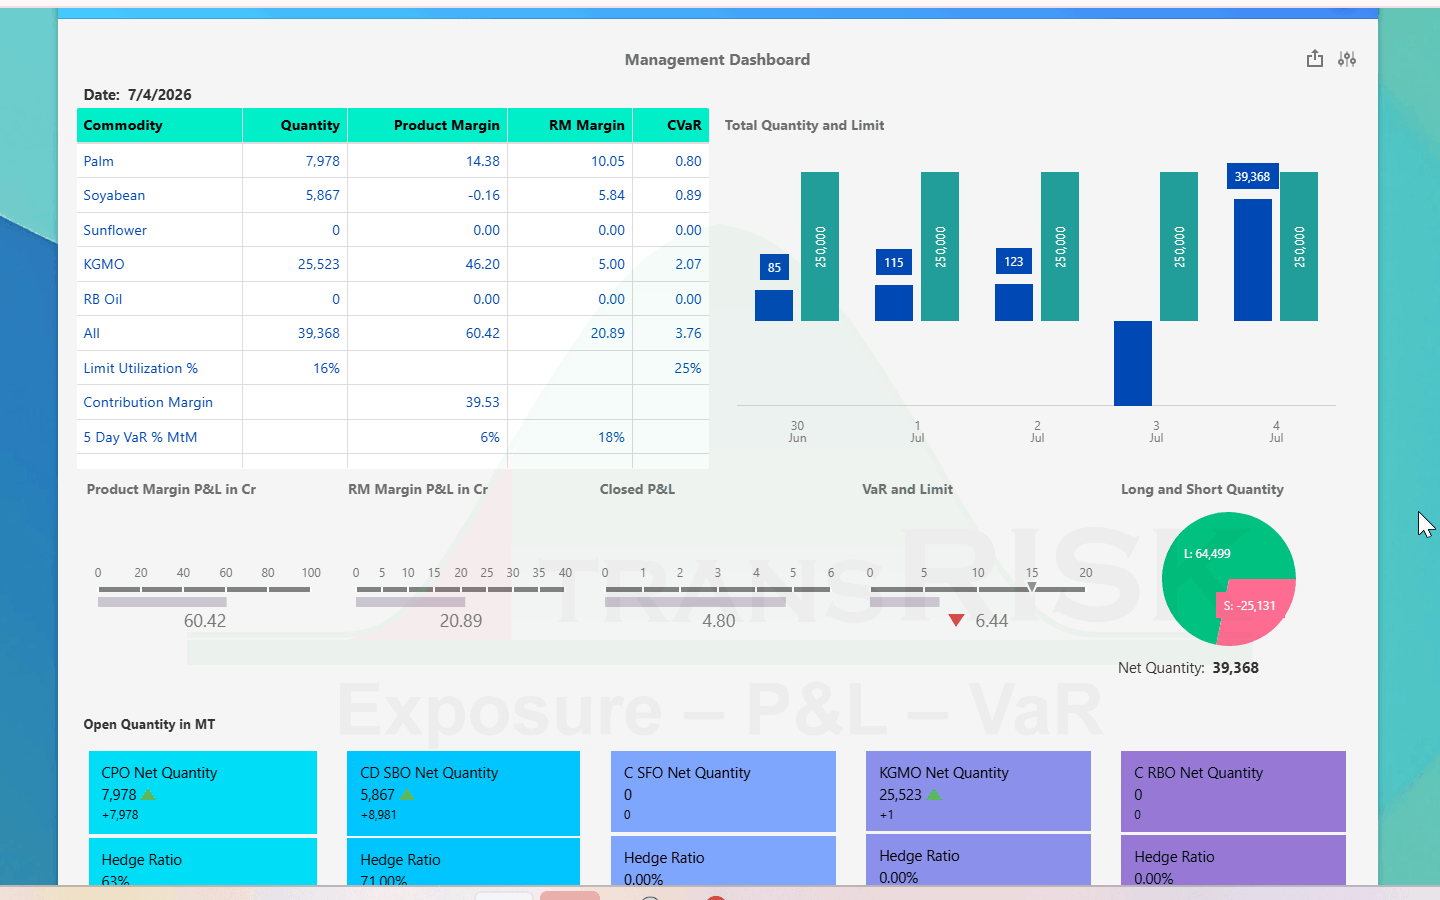
Exposure Management — net open quantity per commodity against limits, with product margin, raw material margin, contribution margin, CVaR and hedge ratio on one screen
Net open quantity per commodity against limits, with margins, CVaR and hedge ratio on one screen
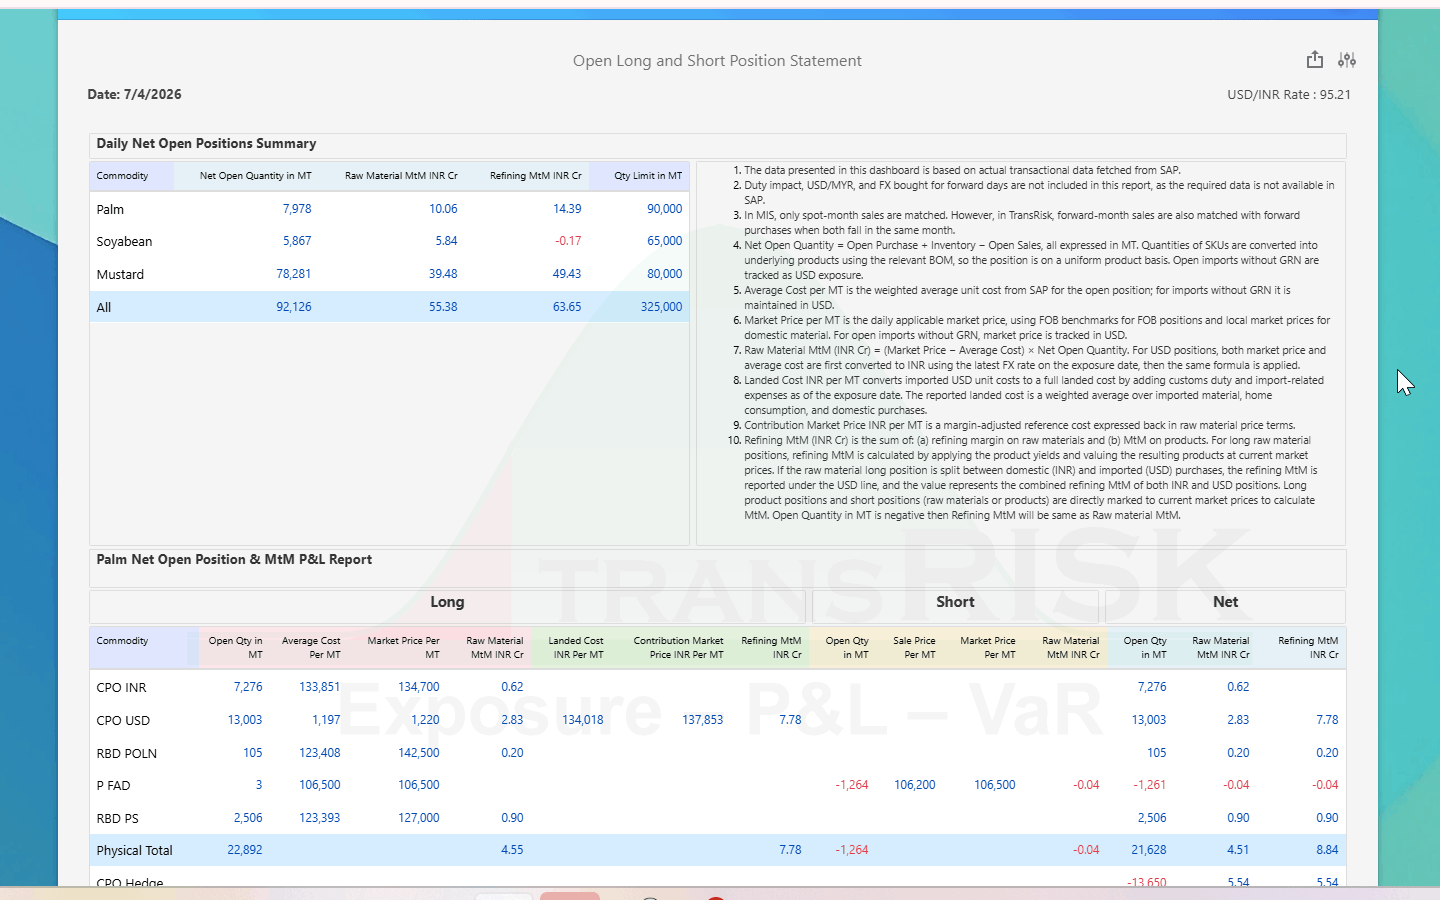
Open Long and Short Position Statement — daily net open position per commodity against its quantity limit, with raw material and refining MtM, average cost, market price, landed cost and contribution market price per MT
One governed net position, switchable across every dimension your business is run on
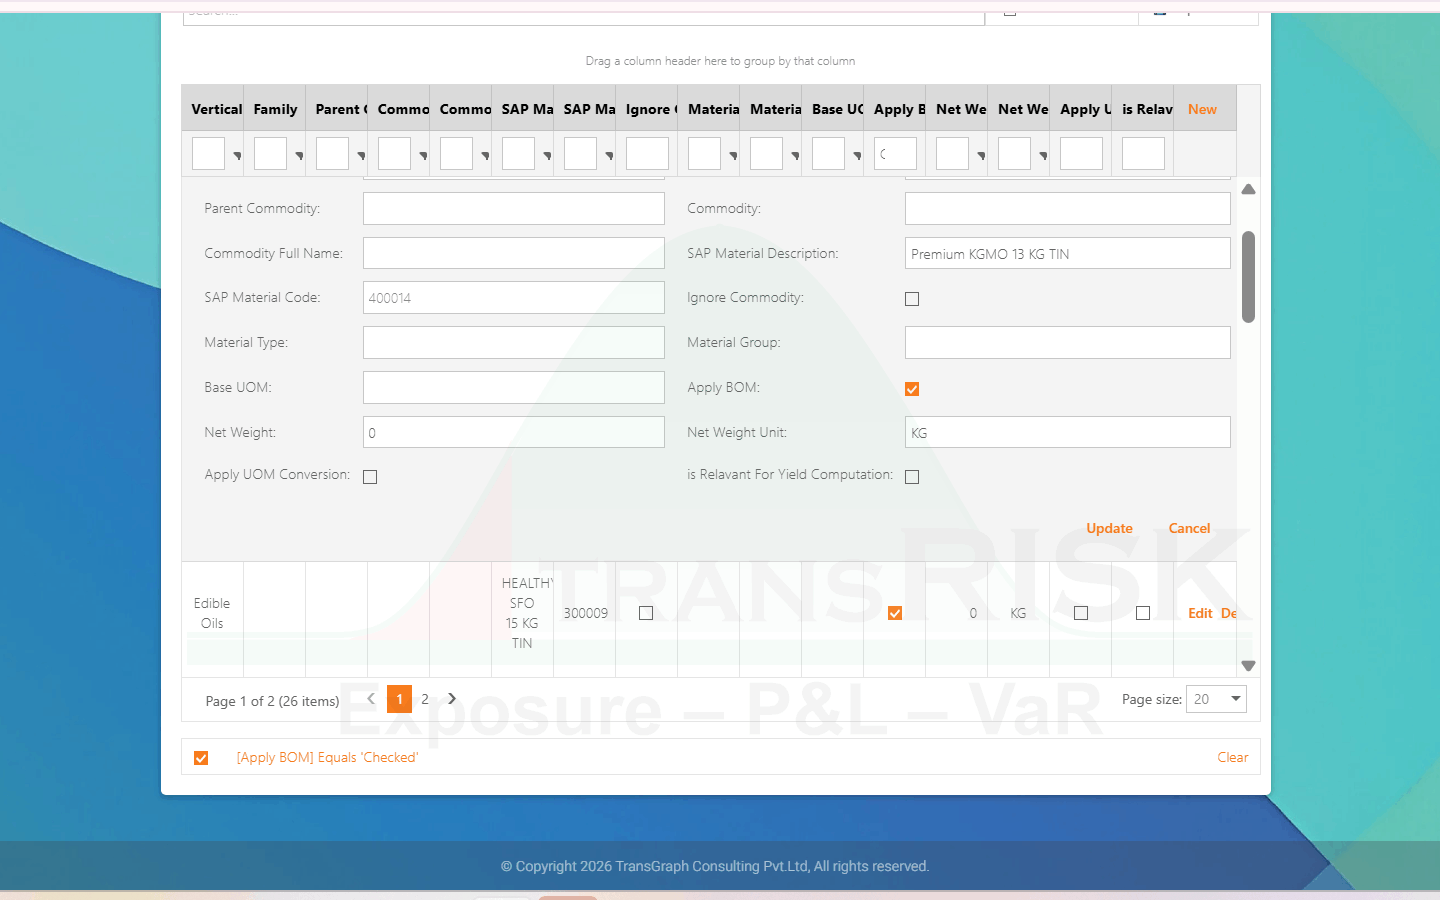
BoM mapping — an ERP material code and description mapped to its parent commodity, with Apply BOM, base unit, net weight unit and yield-relevance flags set per finished-goods SKU
Finished-goods SKUs exploded back into their underlying commodity components

Module 2 of 6

P&L Analytics and Margin Intelligence

Understand how commodity prices, procurement decisions, hedges and operating structures affect P&L and margin.

See the deep dive

What it does

This module explains how commodity prices, procurement decisions, hedges and your own operating structure landed in the P&L — and what margin your plants actually earned while doing it. It produces four P&L measures from one underlying dataset, every morning.

The four measures

Open MtM values open positions against current market prices. Margin P&L, also called structural margin, is the margin between raw material cost and finished-product realisation. Closed P&L, also called Mark-to-Sales or MtS, covers business that is contractually closed but not yet settled. Realised P&L is what has settled. Because all four come from the same dataset they reconcile to each other by construction, and nobody has to bridge them by hand.

The business problem it addresses

Finance, trading and procurement each need a different measure. When those measures are produced separately, in separate spreadsheets, they stop agreeing — and month-end becomes an argument about whose number is right instead of a discussion about what to do next. Margin is the harder half: a published crush or refining spread tells you what a notional plant would have earned in a notional market, not what your facility earned on the parcels it actually processed.

How margin is calculated

Structural margin is built from the data specific to your operation. FIFO lot costs rather than a weighted average. Plant-level yield and recovery rates rather than an industry standard. Full landed cost, including freight, insurance, duty and quality adjustment. And derivative P&L allocated back to each plant in proportion to its share of the hedged exposure. The result is a number a plant manager and a CFO can both stand behind, because it describes that facility rather than a group average.

Which teams use it

Finance uses the realised and closed picture for reporting and budget variance. Procurement uses margin to judge whether the next purchase improves or dilutes it. Trading uses it to see hedge performance. Plant management uses it for conversion economics. Leadership uses forward-period visibility to see profitability building before the period closes.

How it relates to the other five modules

It values the positions Exposure Management consolidates, using costs and prices delivered by Data and Integrations. Risk Measurement and Scenarios then asks what these numbers become if prices move, and Reporting and Decision Support is where each team meets the measure relevant to its accountability.

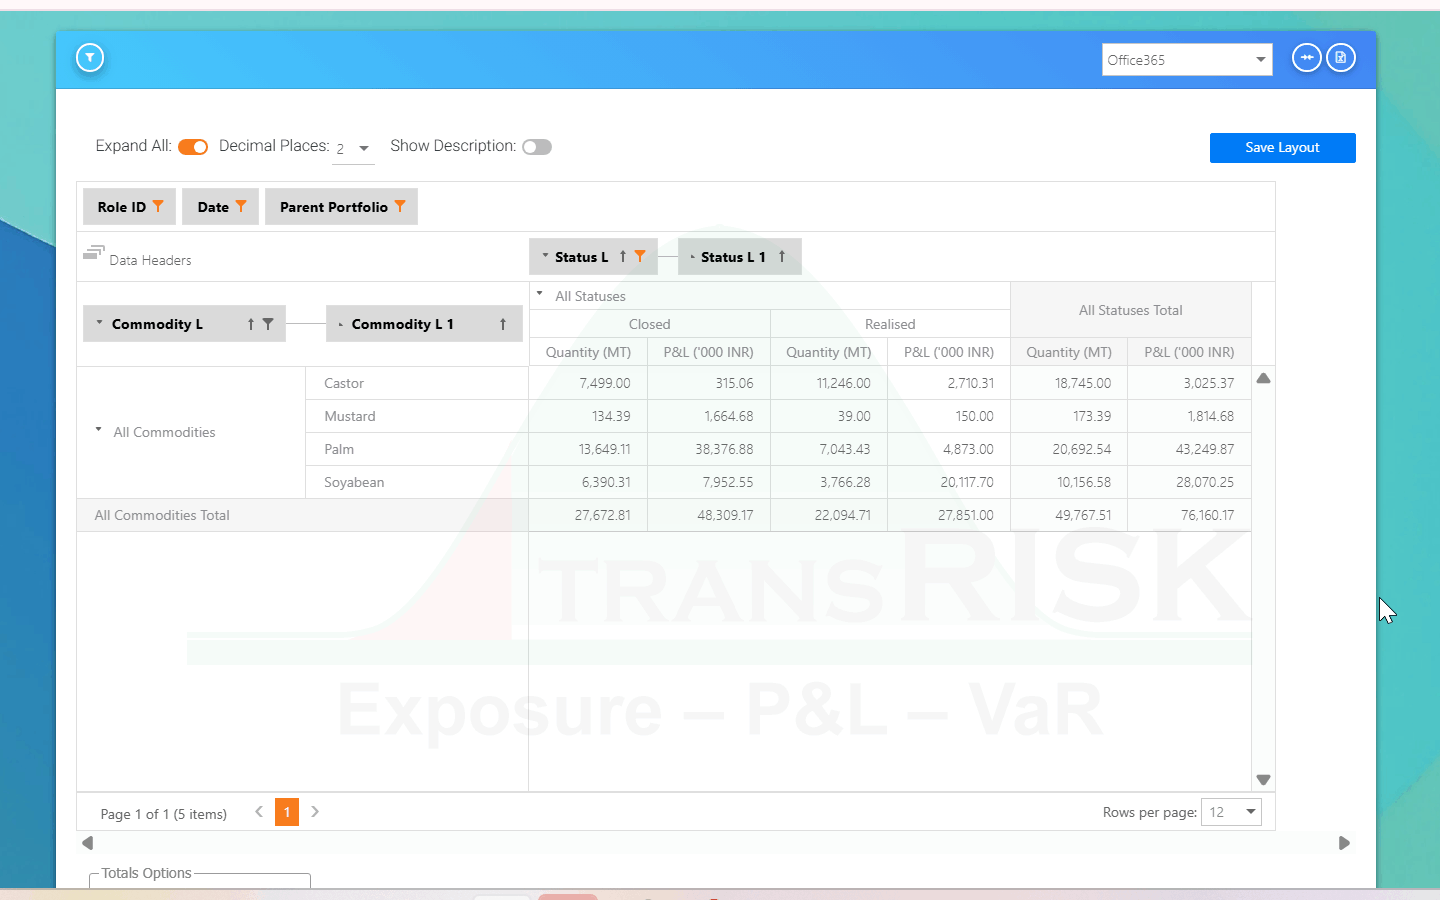
P&L Analytics pivot — Closed and Realised quantity and P&L by commodity, each status shown separately and reconciling to an all-statuses total
All four P&L measures calculated from one dataset — and reconciling to each other
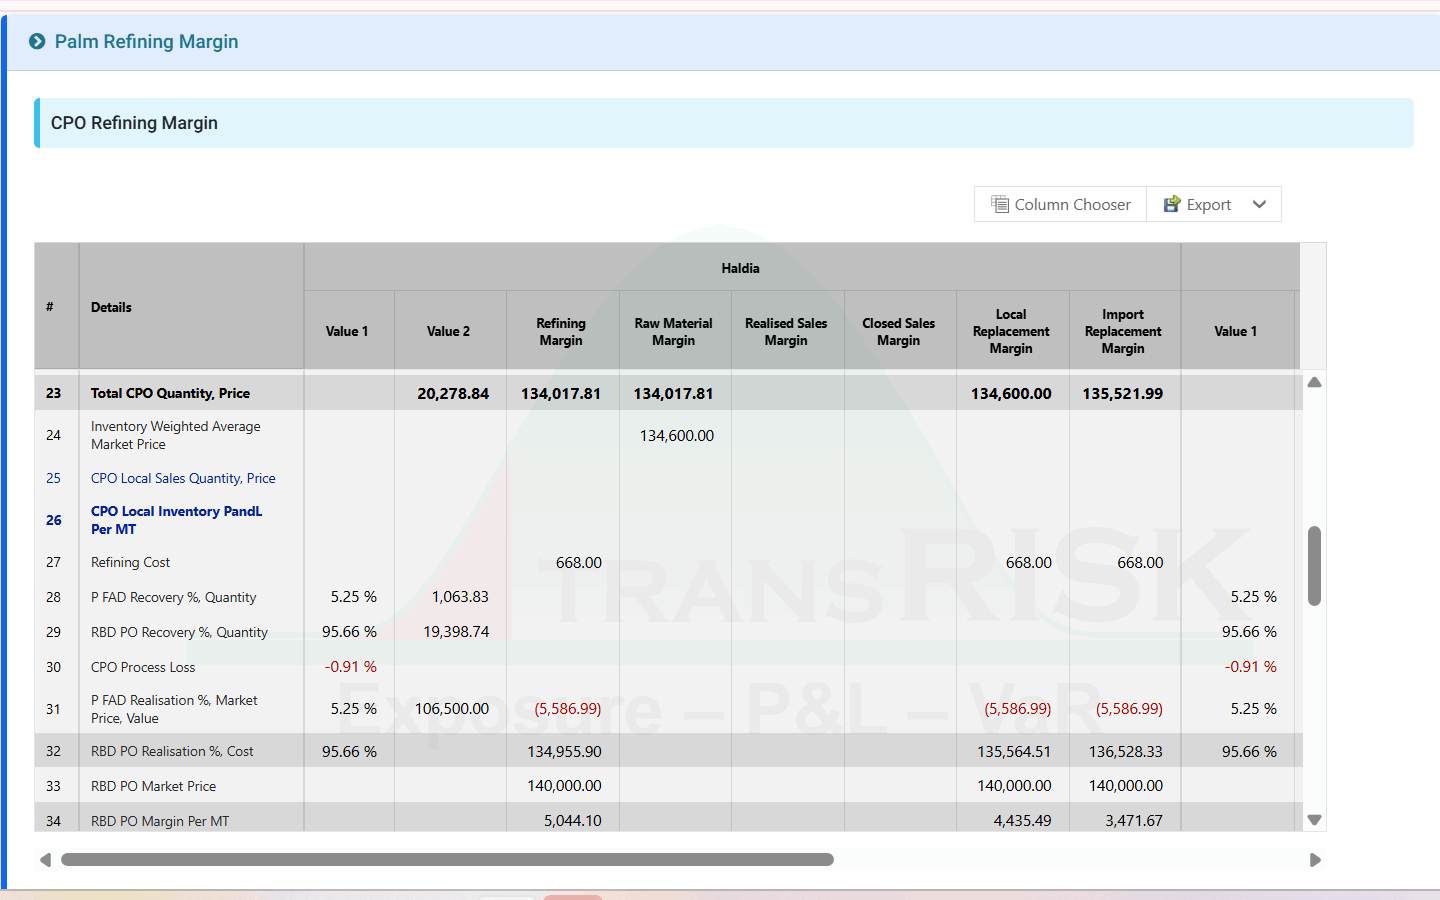
Refining margin by plant — recovery percentages, process loss, refining cost and realisation resolved into refining, raw material, realised sales, closed sales, local replacement and import replacement margin per MT
Structural margin by plant — FIFO input cost, yield, output price, margin against budget
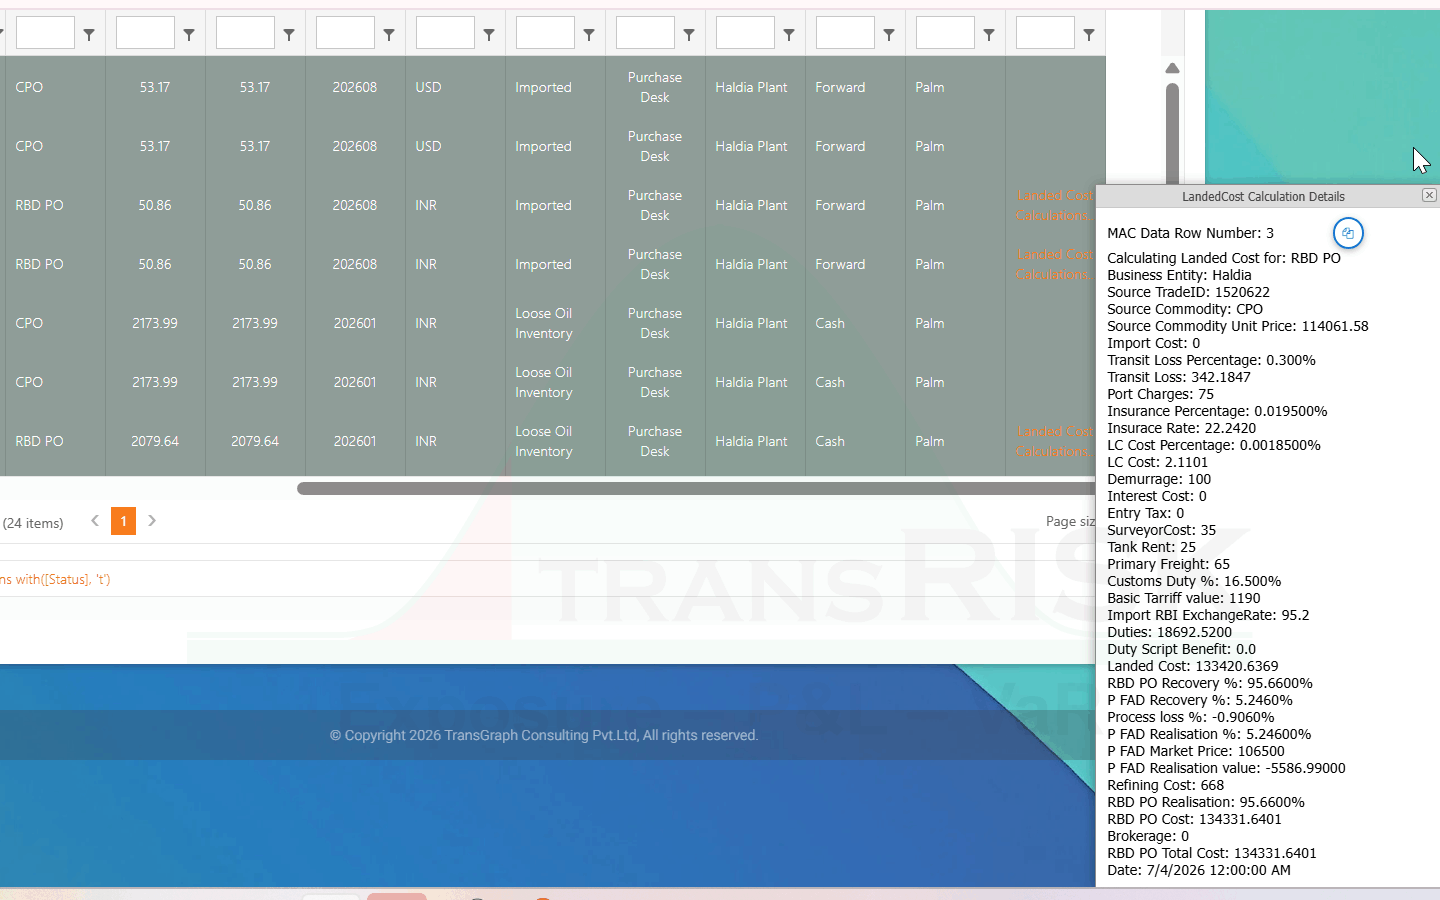
Landed cost build-up — transit loss, port charges, insurance, demurrage, customs duty, basic tariff and import exchange rate resolved into a landed cost per MT for an imported parcel
Landed cost build-up — commodity price, freight, insurance, duty and quality adjustment

Module 3 of 6

Risk Measurement and Scenarios

Measure commodity risk before decisions become breaches — through VaR, scenarios, stress testing and sensitivity analysis.

See the deep dive

What it does

Quantifies commodity risk before a position is taken rather than after a limit is crossed: Value-at-Risk across the whole book, scenario analysis, stress testing and sensitivity analysis, all run on your actual portfolio.

The business problem it addresses

Plenty of organisations produce a VaR number. Far fewer can act on one. A single portfolio figure arriving the morning after tells a trader nothing about which position drove it, whether the hedge genuinely offsets the physical it was placed against, or what a trade under consideration would do to it. Risk reporting becomes a post-mortem — accurate about yesterday, silent about the decision in front of you.

Three methodologies, on your portfolio

Monte Carlo, Historical Simulation and Parametric VaR, selectable by commodity, applied to your positions rather than to a model portfolio. The framework includes Component VaR and Marginal VaR for decomposition, AVaR and PVaR, and treats basis risk and rollover risk as standard rather than as an adjustment. Outputs are backtested against realised P&L so the model itself is under review.

Beyond the headline number

Risk decomposition attributes total portfolio risk down to individual positions. Basis risk analysis compares the physical price against the hedge instrument for each hedged position. Contract rollover risk surfaces upcoming rollovers with current roll spreads and spread volatility. Pre-trade assessment shows portfolio VaR and limit utilisation both before and after a proposed trade, so the analysis changes the decision instead of explaining it afterwards.

Scenarios and stress testing

Price, volatility and exposure scenarios are applied across the full commercial book — inventory, open purchases and forward sales — and shown beside the live position, so the effect on MtM and VaR is visible before anyone commits. Extreme tail-risk scenarios are run the same way.

Which teams use it

Risk owns the methodology and the backtest. Trading uses pre-trade assessment before execution. Procurement runs seasonal what-if analysis ahead of a buying window. Finance and leadership use stress results to size the tolerance the policy should carry.

How it relates to the other five modules

It measures the exposure that Exposure Management consolidates, valued with the same prices behind P&L Analytics and Margin Intelligence. Its VaR output is one of the dimensions on which Limits, Governance and Alerts sets thresholds, and its results appear in the risk views inside Reporting and Decision Support.

VaR configuration — analytical VaR against market price exposure by commodity, with Monte Carlo, historical simulation, EWMA and parametric methods at 95 and 99 per cent selectable as multi-VaR measures
VaR across three methodologies, applied to your actual positions
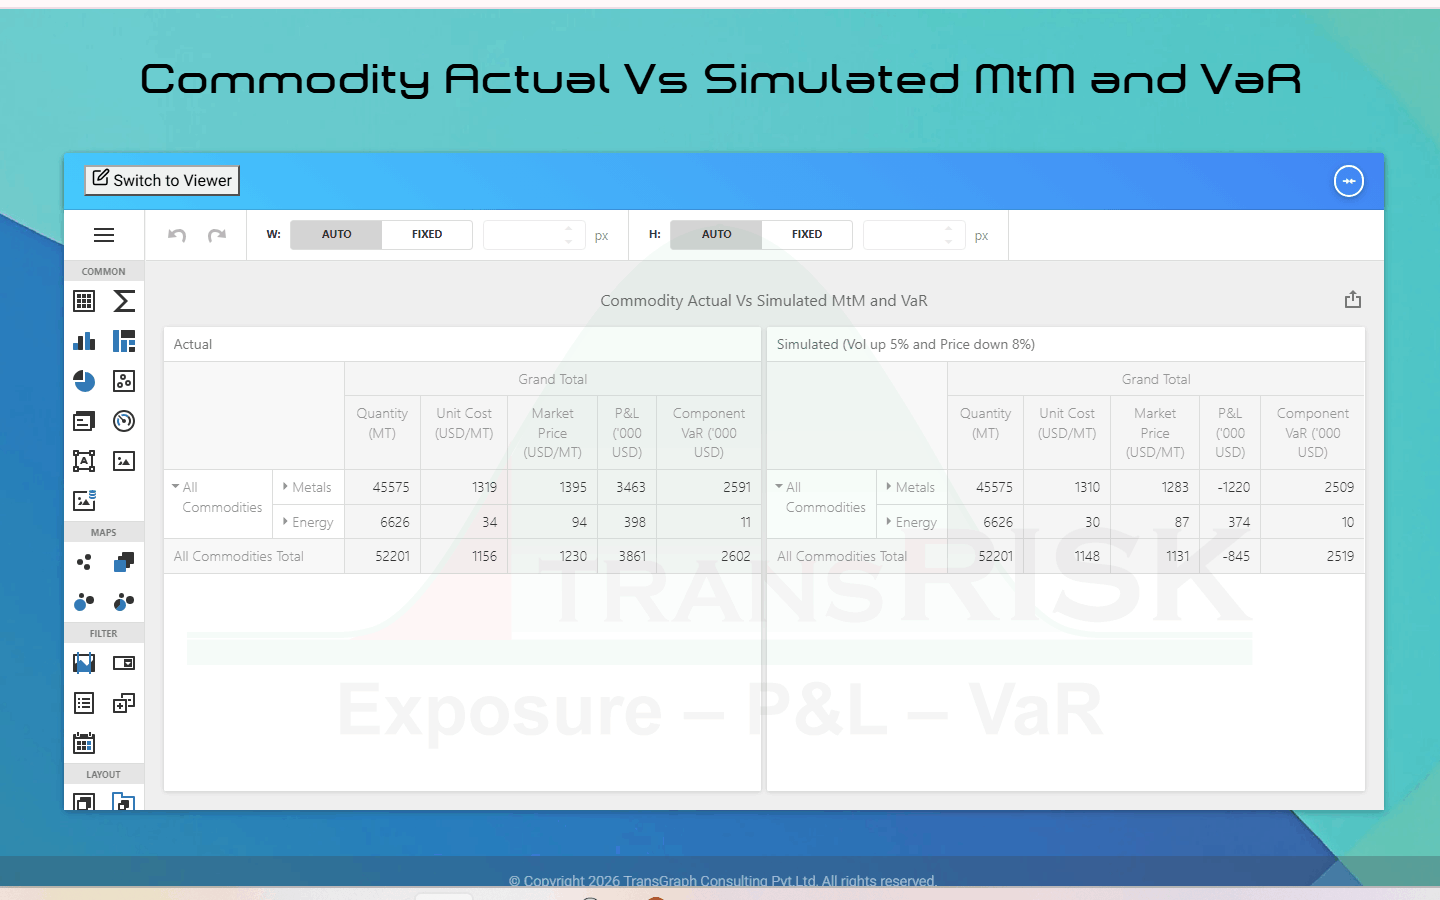
Scenario analysis — a five per cent volatility rise and eight per cent price fall applied to the live book, with actual and simulated quantity, unit cost, market price, P&L and component VaR compared
Price, volatility and exposure scenarios run across the full commercial book
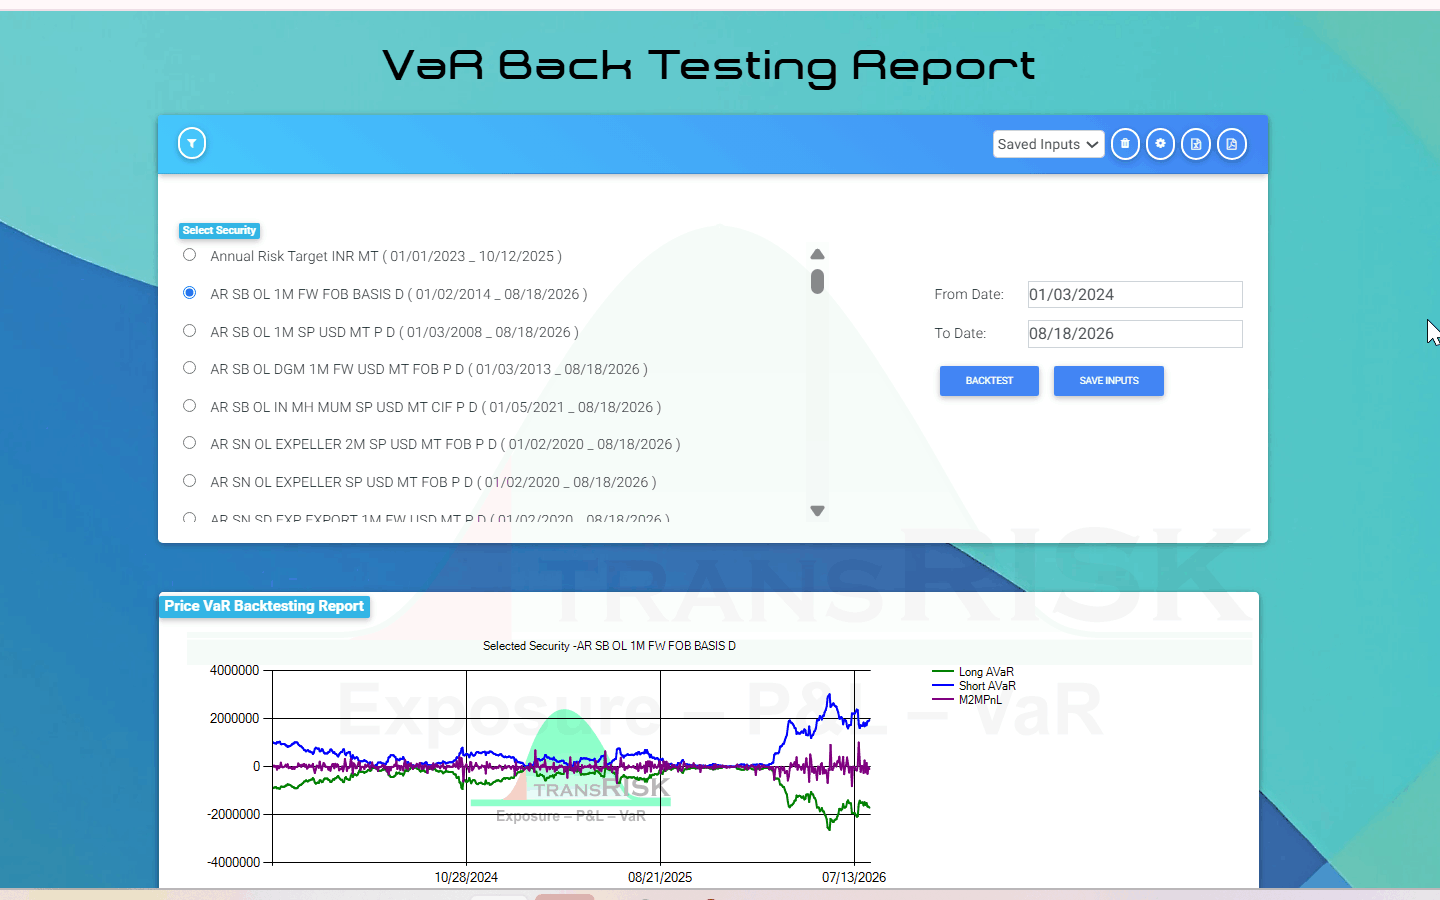
VaR Back Testing — a security and date range selected, with long AVaR, short AVaR and mark-to-market P&L plotted together so breaches of the model are visible
Backtesting — the predicted VaR band against realised daily P&L, with exceptions flagged

Module 4 of 6

Limits, Governance and Alerts

Turn risk policy into continuously enforced controls — limits, utilisation monitoring, alerts and auditability.

See the deep dive

What it does

Turns a written risk policy into controls that run on their own: limits defined across every dimension of the book, utilisation tracked as it changes, warnings before a breach, notification at the moment of one, and an audit trail that assembles itself.

The business problem it addresses

Having a policy is not the same as running one. Where limits are checked by hand they are checked on a cycle — weekly, or whenever someone remembers — and a limit that is crossed on Tuesday is found on Friday, after the position has moved again. The most common failure in commodity risk governance is not a rogue trader. It is inconsistency: the same limit interpreted differently by two desks, or quietly not applied at all during a busy week.

How limits are defined

Across trader, commodity, desk, division, market and VaR — the dimensions your policy already uses, so the platform enforces the document you approved rather than a simplified version of it. Thresholds, warning levels and notification recipients are configured per limit.

What runs without anyone starting it

Utilisation is tracked continuously as a percentage of each threshold. Warning alerts fire at the level you set, before the limit is reached. Breach notifications are sent the moment a threshold is crossed, to whoever the policy designates, carrying the limit, the breached value, the size of the overshoot and the position responsible. Every warning, breach and notification is time-stamped and recorded.

Why the audit trail matters

Because the record is a by-product of the control rather than something assembled afterwards, an internal review or an external examination is answered by querying it. Nobody has to reconstruct who knew what and when, from mailboxes and spreadsheet versions, months after the event.

Which teams use it

Risk defines and maintains the limit framework. Trading checks headroom before executing. Finance leadership and compliance rely on the evidence trail. Internal audit queries it directly rather than requesting a reconstruction.

How it relates to the other five modules

Utilisation is measured against the net position from Exposure Management and the VaR produced by Risk Measurement and Scenarios. Limit status, headroom and the breach log surface inside Reporting and Decision Support, and the position data behind them arrives through Data and Integrations.

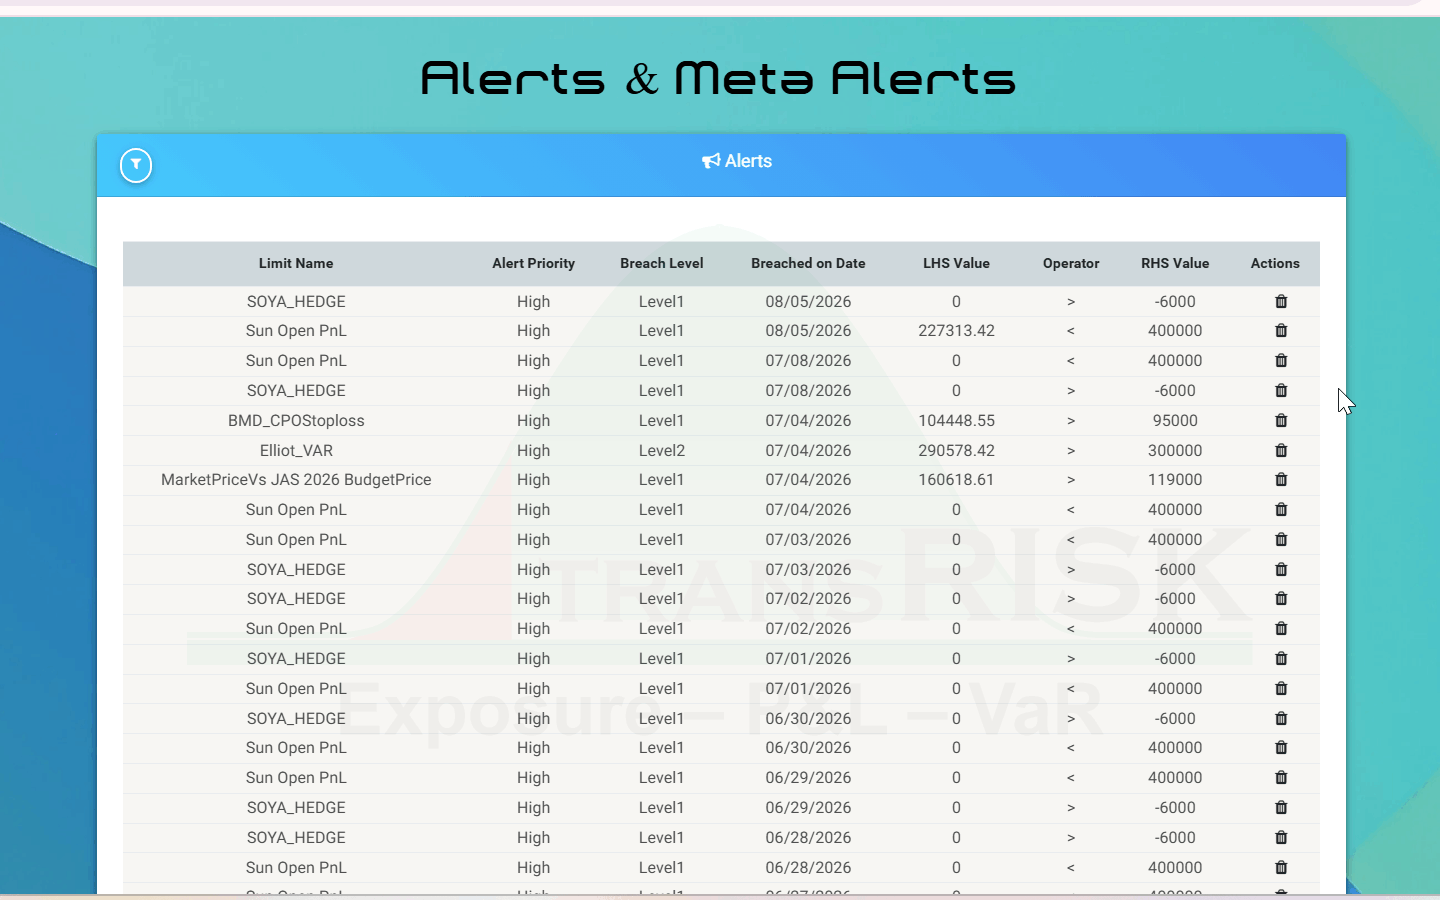
Alerts and meta alerts — every breach listed with limit name, alert priority, breach level, breach date, and the left- and right-hand values that triggered it
Breach notification — the limit, the breached value, the overshoot and the responsible position
Limit utilisation tracked continuously across every dimension
Limit utilisation tracked continuously across trader, commodity and desk

Module 5 of 6

Reporting and Decision Support

Give procurement, trading, finance, risk and leadership teams one reliable cockpit for daily decisions.

See the deep dive

What it does

Gives every team that carries commodity accountability one cockpit — the exposures, P&L, margins, risk and limit positions each of them needs, prepared overnight and waiting when they arrive.

The business problem it addresses

In many organisations the first two hours of the day go on rebuilding the same report: exporting from the ERP, pulling broker positions, refreshing prices, reconciling the differences, formatting the result. The work is repeated every morning, it is the step where most errors enter, and it consumes exactly the people who should be interpreting the numbers rather than assembling them.

Role-specific views, not filtered copies

Five dashboards — executive, risk, trading, procurement and finance — each built around a different accountability rather than being the same screen with different column filters. The executive view carries enterprise exposure, margin against budget and VaR against policy. The trading view carries position detail, hedge ratio, limit headroom and pending rollovers. The procurement view carries purchase commitments, landed cost and margin. Graphical and tabular content sit in the same screen.

Asking a new question without building a new report

OLAP-style drill-down moves from any summary to the underlying positions and pivots there. User-defined reports save automatically. Existing internal report formats can be reproduced, so adopting the platform does not force every recipient to relearn the document they have read for years. Scheduled distribution sends the right report to the right list on the right cadence, without anyone preparing it.

Decision support, beyond reporting

Purpose-built workspaces bring exposure, margin and risk together per commodity group, alongside position notes and hedge monitors. Automated MIS covers raw materials, finished goods and by-products, with plant-level mapping for management briefing — business-ready analytics rather than a data extract someone still has to interpret.

Which teams use it

Procurement, trading, finance, risk and leadership — which is the point. The same platform serves the trading floor and the boardroom, from one set of numbers.

How it relates to the other five modules

It presents what the other five produce: exposure from Exposure Management, the four measures and structural margin from P&L Analytics and Margin Intelligence, VaR and scenarios from Risk Measurement and Scenarios, utilisation and breaches from Limits, Governance and Alerts, all on data delivered by Data and Integrations.

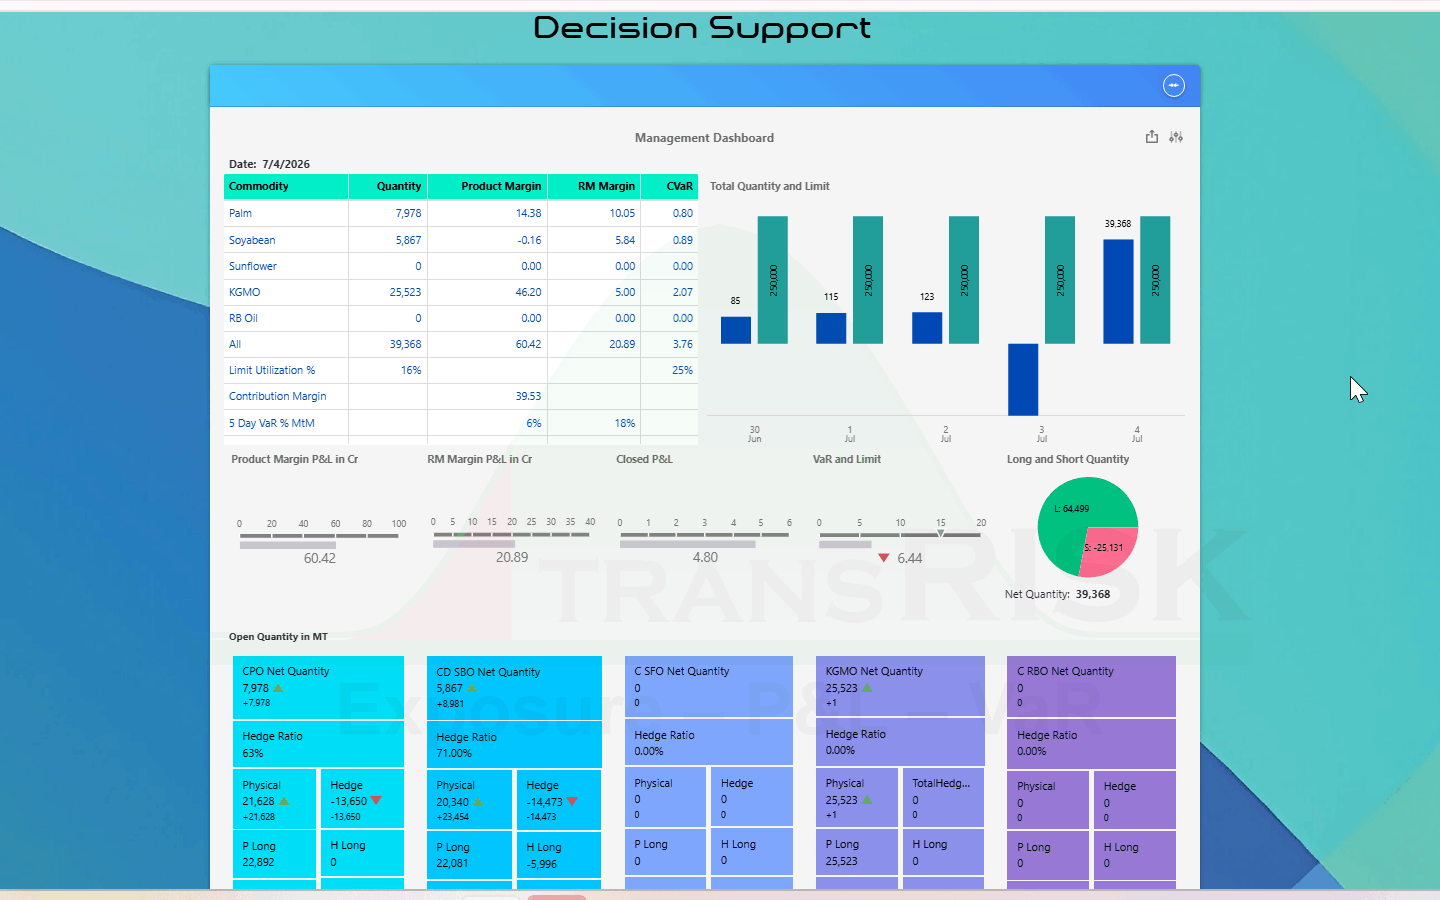
Management dashboard — quantity, product margin, raw material margin and CVaR per commodity, limit utilisation, five-day VaR against MtM, the long and short split, and open quantity with hedge ratio per position
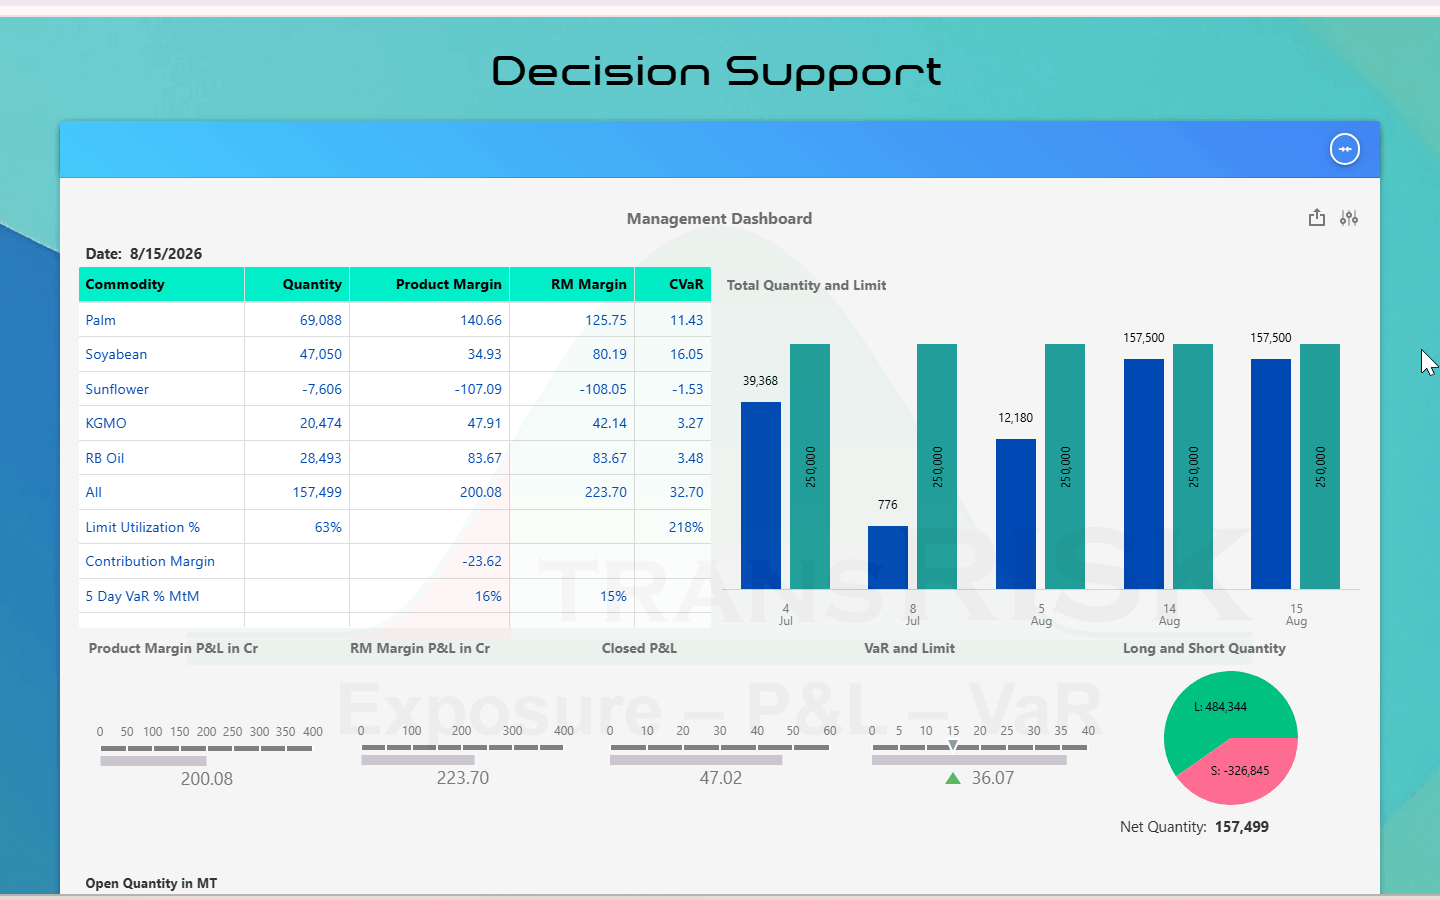
The cockpit — exposures, P&L, margins, risk and limit utilisation in one screen
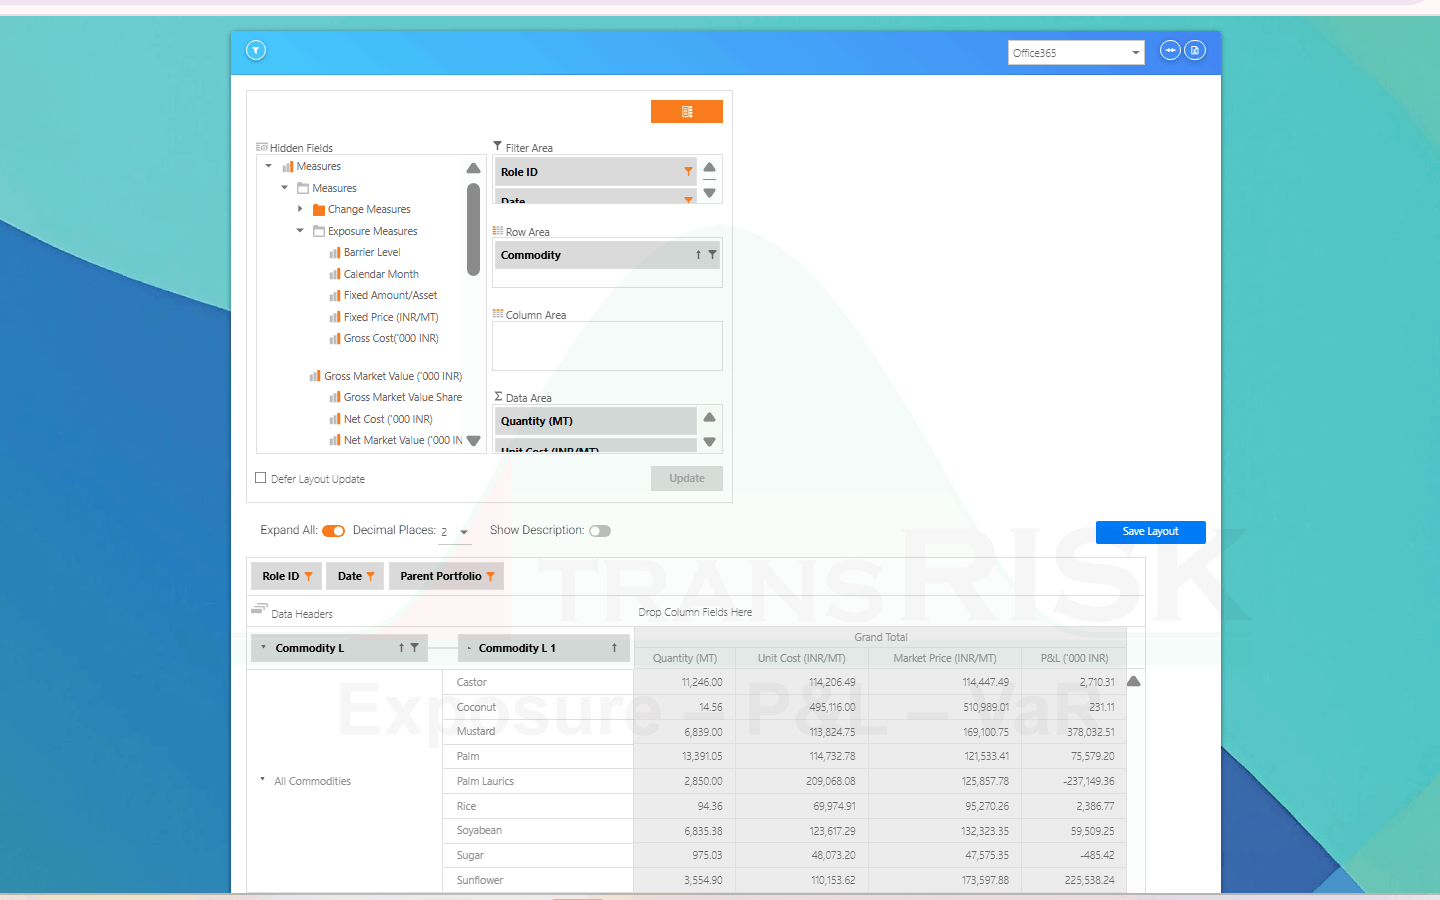
OLAP drill-down — measures and dimensions dragged into filter, row, column and data areas, with quantity, unit cost, market price and P&L pivoted by commodity
Drill-down from any summary to the underlying positions, and pivot there
Decision Support management dashboard — product margin, raw material margin and CVaR per commodity, limit utilisation, five-day VaR against MtM, and open quantity with hedge ratio per position
Workspaces opened per commodity group, with position notes and hedge monitors alongside

Module 6 of 6

Data and Integrations

Connect ERP, broker, market and operational data so teams stop re-entering information and work from a trusted data foundation.

See the deep dive

What it does

Connects ERP, broker, market and operational data to TransRisk so positions arrive automatically, are validated before they are used, and give every other module one trusted foundation to calculate from.

The business problem it addresses

Re-keying. Positions are exported from the ERP into a spreadsheet, broker statements are retyped from their native formats, prices are pasted in from a terminal — and every hop is an opportunity to introduce an error that nobody can trace back later. Meanwhile the positions that live outside any system at all, held in someone's workbook, never reach the risk view. The daily reconciliation that follows is not analysis; it is repair work.

What connects

SAP FICO and MM through native ETL developed in-house rather than third-party middleware, with bi-directional sync and multiple SAP instances across entities and geographies supported. Oracle and other ERPs through configured pipelines. Trading systems through API connectors. Broker statements ingested in their native formats and standardised automatically into TransRisk position data. Out-of-system positions through a governed Excel upload that validates on the way in and flags rejected rows for review rather than accepting them silently.

Price data

Your own price database, custom series for proprietary grades and locations, or live feeds from authorised market providers — in any combination. Price-to-position mapping is validated before it is applied to a P&L or VaR calculation, so a mismapped series is caught rather than quietly distorting a result.

Rules, quality and control

A rules engine validates data on ingest. Conversion rules map commodity to end product, and bill-of-materials definitions map SKUs to their components. Data-quality reporting and process history make the overnight cycle inspectable rather than opaque. Role-based access with desk, commodity and field-level permissions controls exactly what each user sees.

Which teams use it

IT and data owners configure and run it. Everyone else benefits from it without touching it — which is the measure of whether it is working.

How it relates to the other five modules

Every other module reads from here. Exposure Management nets what arrives, P&L Analytics and Margin Intelligence values it, Risk Measurement and Scenarios models it, Limits, Governance and Alerts tests it against policy, and Reporting and Decision Support presents it.

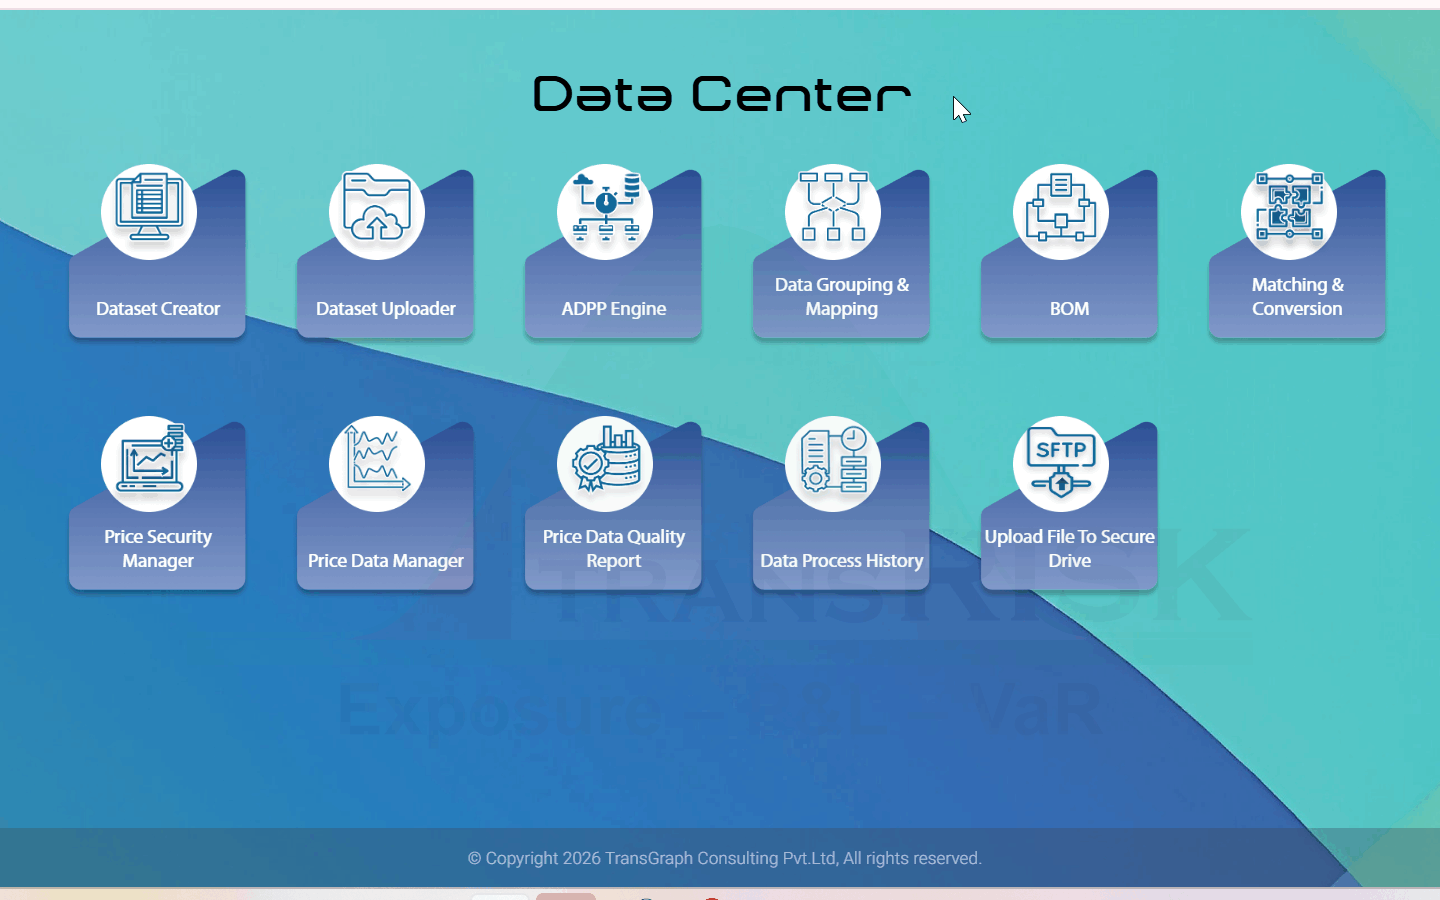
Dataset creator and uploader, ADPP engine, data grouping and mapping, BoM, matching and conversion, price security and price data managers, data quality report, process history and secure-drive upload
Dataset upload, validation rules, mapping, conversion and data-quality reporting in one place
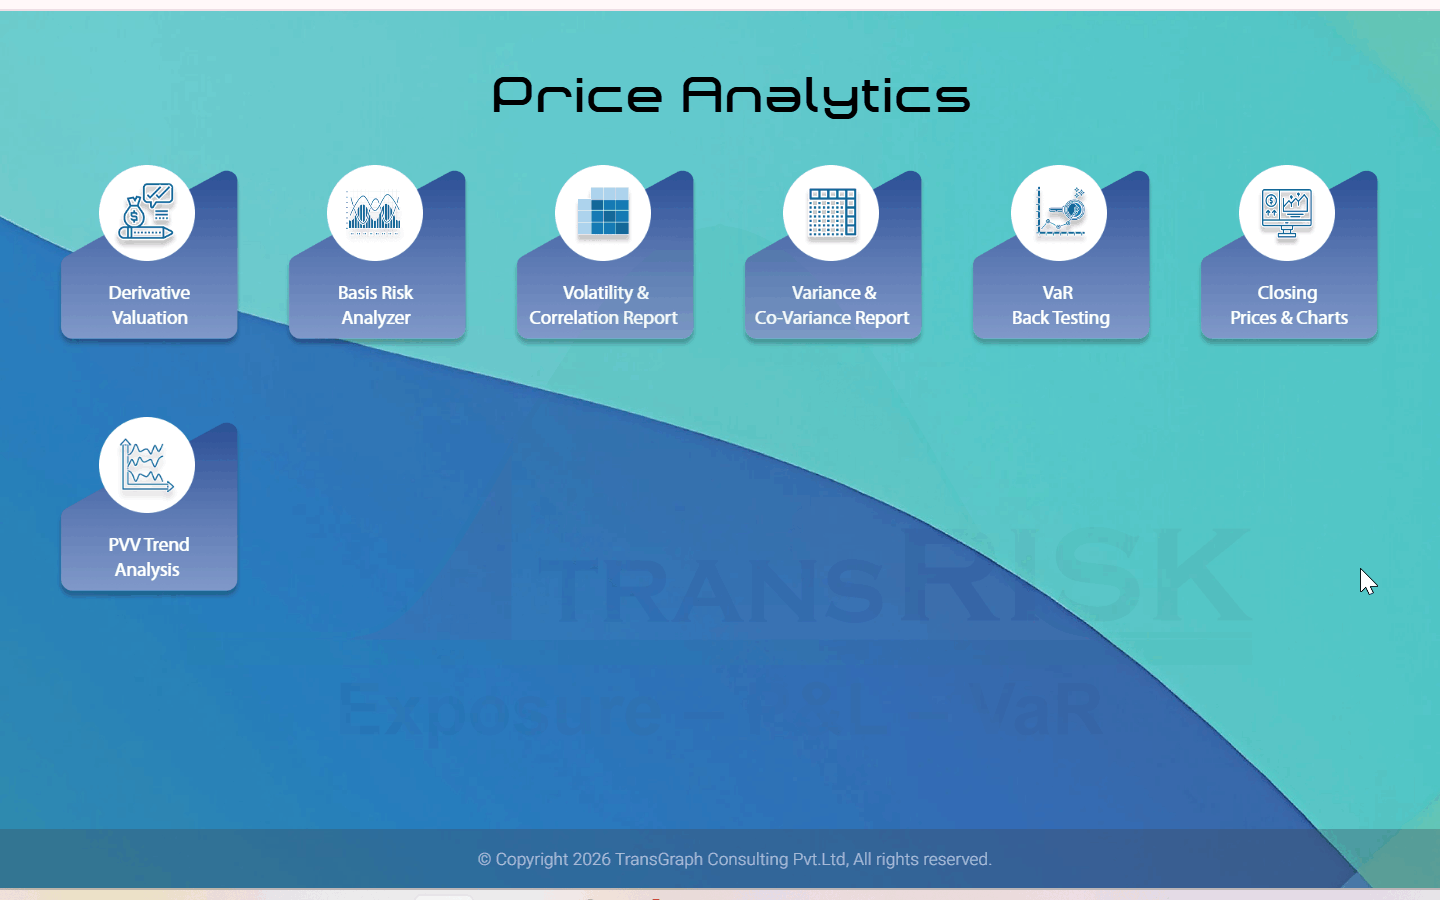
Price data and analytics screen — derivative valuation, basis risk analyzer, volatility and correlation, variance and co-variance, VaR back testing, closing prices and charts, and PVV trend analysis
Price data, valuation, basis and volatility analysis feeding the same calculations
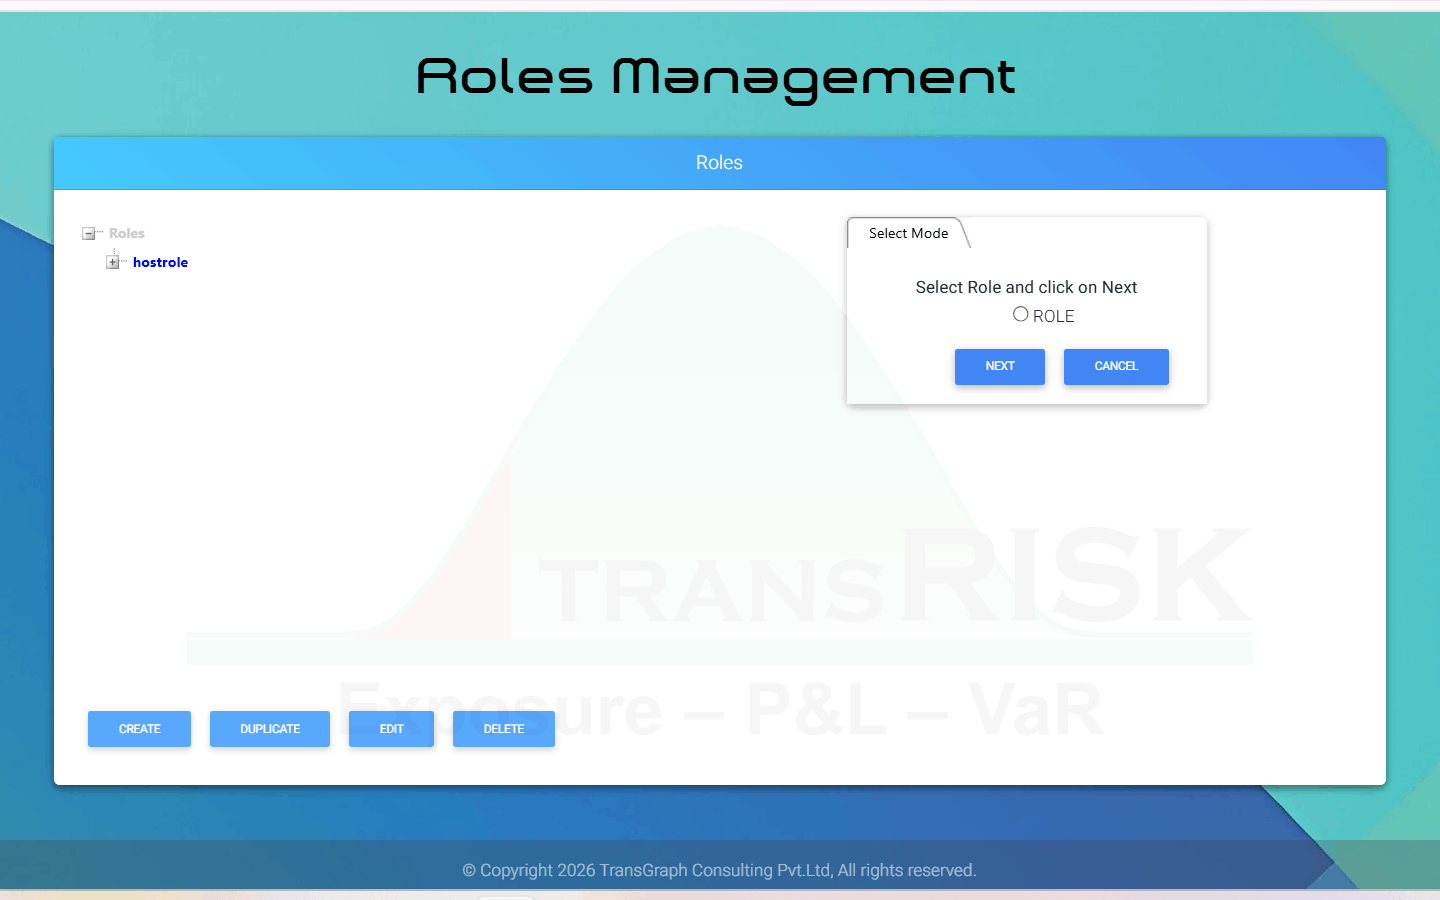
Roles Management — the role tree with create, duplicate, edit and delete, and the mode selector for building a new role
Role, desk, commodity and field-level permissions over the consolidated data

Across all six modules

Reference · not a module

Instruments Coverage

Every instrument your desk actually uses — valued with the model that exercise style requires, and included in the same exposure, P&L and VaR view as the physical book.

See the deep dive

What it covers

Commodity hedging is not one instrument. A single programme routinely runs spot and forward purchases alongside futures, standard and average swaps, calls and puts, collars, and structures written for one counterparty. TransRisk values the full spectrum — including digital, barrier, extendible and spread options, and OTC exotics — and new instrument types are added continuously by the in-house risk team.

Why the valuation model is the point, not the instrument list

Supporting an instrument and valuing it correctly are different claims. An average-rate option settles against a mean price, so a model built for a single exercise date misprices it from the first day of the averaging window. TransRisk prices European, American and average-rate styles each with the model that exercise style requires, and calculates the full set of Greeks — delta, gamma, vega, theta and rho — for every position rather than for the vanilla subset.

How it reaches the risk view

Every instrument lands in the same consolidated net exposure, the same four P&L measures and the same VaR run as the physical book. There is no separate derivatives report to reconcile against the physical one, and no asset class sitting outside the number your risk policy is written against — which is the usual reason a hedge looks effective on one report and not on another.

Risk is attributed by instrument type as well as by commodity, so a book that mixes futures with average-rate options shows which part of the exposure each structure is actually covering, rather than one blended figure that hides the difference.

Which teams rely on it

Trading, because a structure has to be valuable before it is useful. Risk, because an instrument missing from the valuation engine is missing from VaR, and an exposure you cannot measure is one you cannot govern. Finance, because the mark on an exotic is the mark that reaches the accounts, and an approximation there becomes an audit question later.

Where this sits in the platform

Instrument coverage is not a module — it is the valuation layer the six modules share. Exposure Management nets these positions against physicals, P&L Analytics and Margin Intelligence marks them, Risk Measurement and Scenarios includes them in VaR and stress runs, and Limits, Governance and Alerts counts them against the same thresholds as everything else.

Derivative Valuation — a plain vanilla option valued against an exposure position, with expiry, strike, quantity, underlying and risk-management security, conditional volatility and interest rate
An option valued against its exposure position, with the full Greeks alongside

ANALYTICS IN DEPTH

How each capability works

Open Long and Short Position Statement — daily net open position per commodity against its quantity limit, with raw material and refining MtM, average cost, market price, landed cost and contribution market price per MT
Exposure Management — net position by commodity, plant, division and trade flow

Position data flows automatically from ERP, broker statements, and trading systems into a single calculation engine. The engine applies your netting rules, conversion ratios, and BoM mappings — then produces a consolidated net position across every dimension your teams need: commodity, plant, division, trade flow, period, and product form. No manual consolidation step. No version conflict between teams. The number is ready every morning before your teams start work.

P&L Analytics pivot — Closed and Realised quantity and P&L by commodity, each status shown separately and reconciling to an all-statuses total
P&L Analytics — Open MtM, Margin P&L, Closed P&L and Realised P&L in one screen

Four P&L measures — Open MtM, Margin P&L, Closed P&L, and Realised P&L — calculated from one underlying dataset every morning. No manual reconciliation between any of them. Finance sees the realised and closed picture for reporting. Procurement sees Closed P&L (Mark-to-Sales) margin to inform the next purchase. Risk sees MtM budget variance against open positions. All from the same source.

Refining margin by plant — recovery percentages, process loss, refining cost and realisation resolved into refining, raw material, realised sales, closed sales, local replacement and import replacement margin per MT
Structural margin — FIFO input cost, plant yield, output price and margin vs budget

Structural margin calculated using the data specific to your operation: FIFO lot costs, plant-level yield and recovery rates, full landed cost per shipment, and derivative P&L allocated back to each plant by proportional exposure. The result is a number that a plant manager and a CFO can both stand behind — because it reflects what actually happened in that facility, not a group average or a market benchmark.

VaR configuration — analytical VaR against market price exposure by commodity, with Monte Carlo, historical simulation, EWMA and parametric methods at 95 and 99 per cent selectable as multi-VaR measures
VaR run — Monte Carlo, Historical Simulation and Parametric with loss distribution

Three VaR methodologies — Monte Carlo, Historical Simulation, and Parametric — applied to your actual positions, not a model portfolio. Component and Marginal VaR decompose total risk to the position level. Basis risk and rollover risk are analysed explicitly for each hedged position. Pre-trade assessment is built in: add a proposed trade and see its VaR impact before execution. All outputs are backtested against realised P&L.

Limit utilisation — heat map across trader, commodity and desk

Limits defined once across traders, commodities, desks, divisions, and markets. Utilisation tracked continuously as a percentage of each threshold. Warning alerts fire before a breach. Breach notifications sent the moment a limit is crossed — to whoever your policy designates, with the position detail and breach magnitude included. Every event is time-stamped and logged automatically. The audit trail is queryable for internal review or regulatory examination without anyone having to reconstruct it.

Management dashboard — quantity, product margin, raw material margin and CVaR per commodity, limit utilisation, five-day VaR against MtM, the long and short split, and open quantity with hedge ratio per position
Executive cockpit — exposure, P&L, margin, VaR and limit utilisation in one screen

Five role-specific dashboards — executive, risk, trading, procurement, and finance — each showing the five dimensions that matter: exposures, P&L, margins, risk, and limits. Graphical and tabular in the same screen. OLAP drill-down from any summary to the underlying positions. User-defined reports with auto-save. Scheduled automated distribution. Legacy internal report formats supported. The manual morning report cycle ends when TransRisk goes live.

Derivative Valuation — a plain vanilla option valued against an exposure position, with expiry, strike, quantity, underlying and risk-management security, conditional volatility and interest rate
Asian option valued with Turnbull-Wakeman, full Greeks shown

A platform that cannot value the instruments your desk actually uses is not a risk platform — it is a partial view. TransRisk supports the complete instrument spectrum: spot, forwards, futures, standard and average swaps, calls, puts, collars, digital options, barrier options, extendible options, and OTC exotic structures. European, American, and Asian (average-rate) pricing styles are each valued using the correct model for that exercise style — not approximated. Full Greeks calculation: delta, gamma, vega, theta, and rho. Every instrument feeds into the same consolidated net exposure, P&L, and VaR calculation. No reconciliation between asset classes.

ADPP engine API trigger — exposure date and commodity group set, with master data, BoM, inventory, purchases and sales selected for an incremental upload
SAP FICO and MM ETL — positions, inventory and commitments with validated write-back

SAP FICO and MM via native ETL, Oracle and other ERPs via configured pipelines, trading systems via API connectors, broker statements converted from native formats, and out-of-system positions via governed Excel upload. Price data from your own database, custom proprietary series, or authorised market feeds — validated before being applied. Role-based access, desk and commodity-level data segregation, and field-level permissions control exactly what each user sees.

Fits into your existing technology stack

SaaS Delivery

Hosted, maintained and updated by TransRisk. No infrastructure overhead for your IT team.

On-Premise Installation

Deploy within your own environment for maximum data control and security compliance.

ERP / Trading System Integration

Connects to SAP, legacy ERP, trading platforms and Excel. Data flows in automatically.

Excel Upload Fallback

No ERP? No problem. Structured Excel upload with full validation — for any company at any stage.

COMMON QUESTIONS

TransRisk questions, answered

TransRisk is a commodity exposure, P&L, margin and risk management platform built by TransGraph Consulting Pvt. Ltd. It consolidates physical and derivative positions from ERP systems, broker statements and trading platforms into a single daily view of exposure, P&L, margin and Value-at-Risk. It is delivered as SaaS or on-premise and is used by more than 150 enterprises across 8 industries.

Open MtM (Mark-to-Market), Margin P&L (structural margin), Closed P&L (also called Mark-to-Sales or MtS) and Realised P&L. All four are calculated automatically every morning from one underlying dataset, so there is no manual reconciliation between them. Each function sees the measure relevant to its accountability.

Yes. TransRisk includes native SAP FICO and MM ETL development — no third-party middleware. Physical positions, inventory, purchase orders and sales commitments are pulled automatically, bi-directional sync is supported, and multiple SAP instances across entities and geographies are supported. There is no manual export or re-keying.

Three: Monte Carlo, Historical Simulation and Parametric, selectable by commodity. The framework includes Component VaR, Marginal VaR, AVaR and PVaR, and covers basis risk and rollover risk as standard. Results are backtested against LME, CME, CBOT and NYMEX, with breach percentages within international norms.

Yes. Asian, Barrier, Collar and Digital options are priced and included in VaR, alongside spot, forwards, futures, swaps and OTC structures.

Six integrated modules: Exposure Management, P&L Analytics and Margin Intelligence, Risk Measurement and Scenarios, Limits, Governance and Alerts, Reporting and Decision Support, and Data and Integrations. All six run on one automated data layer, so the numbers reconcile across them without manual effort. Clients commonly start with Exposure Management and P&L Analytics and Margin Intelligence, and activate the others in later phases.

See every module working on your commodity portfolio.

We configure every demo to your industry, your commodities and your current workflow.