WHY TRANSRISK
Why commodity enterprises choose TransRisk
Spreadsheets are not a risk management tool. They are a data storage tool used as a risk management tool because nothing better was available. TransRisk was built to replace exactly this — not as a generic risk platform adapted for commodities, but as a purpose-built system for manufacturing, processing, trading, and FMCG businesses. One platform. One accurate view. Updated automatically. Enforced consistently.
Talk to an ExpertSix reasons
Six reasons commodity teams choose TransRisk over every alternative.
-
One platform for every dimension of commodity risk
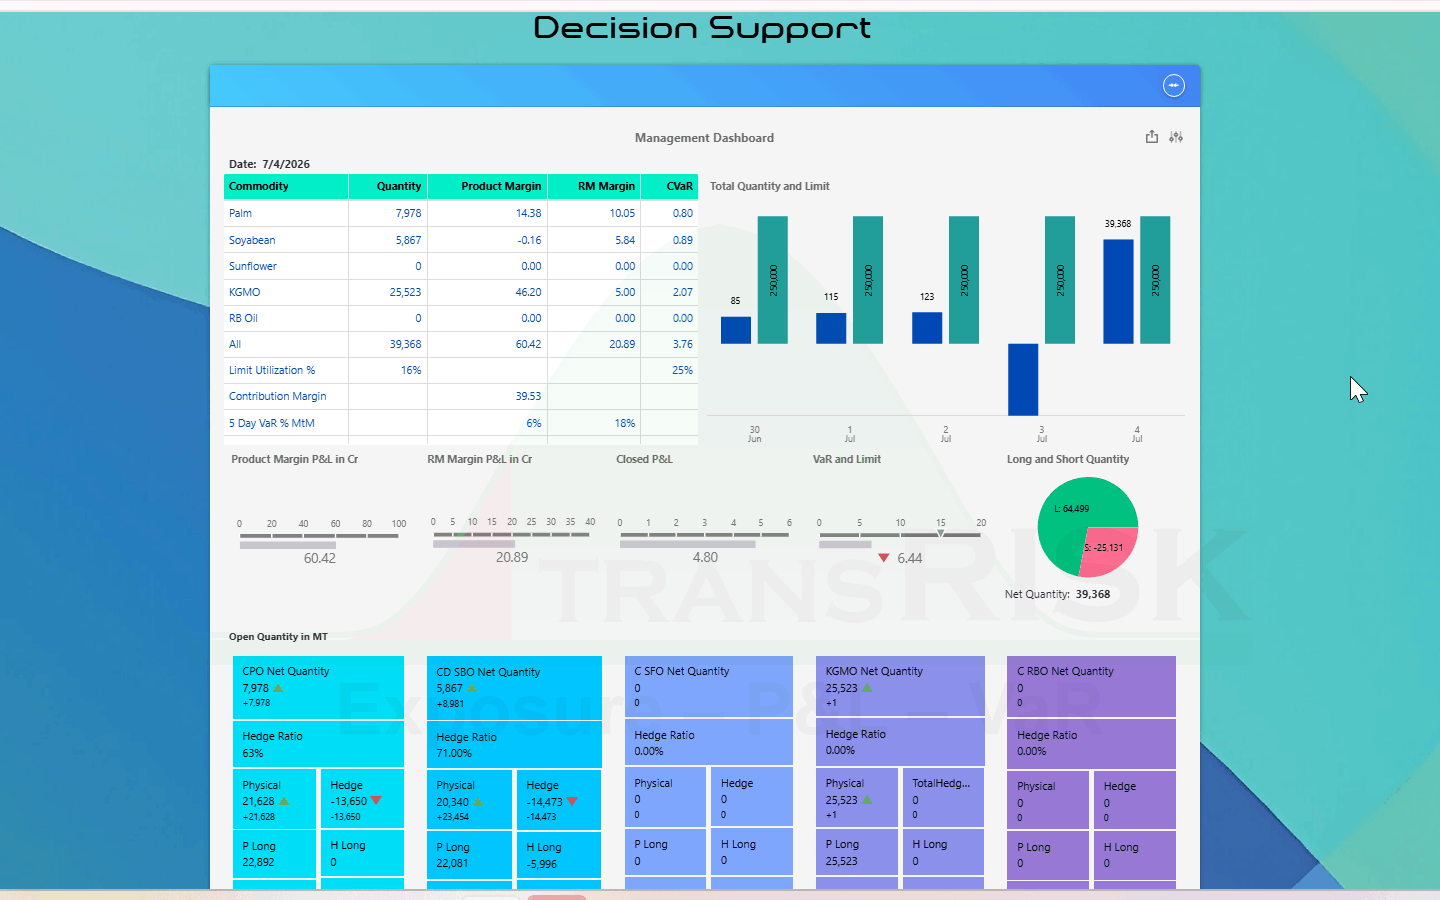
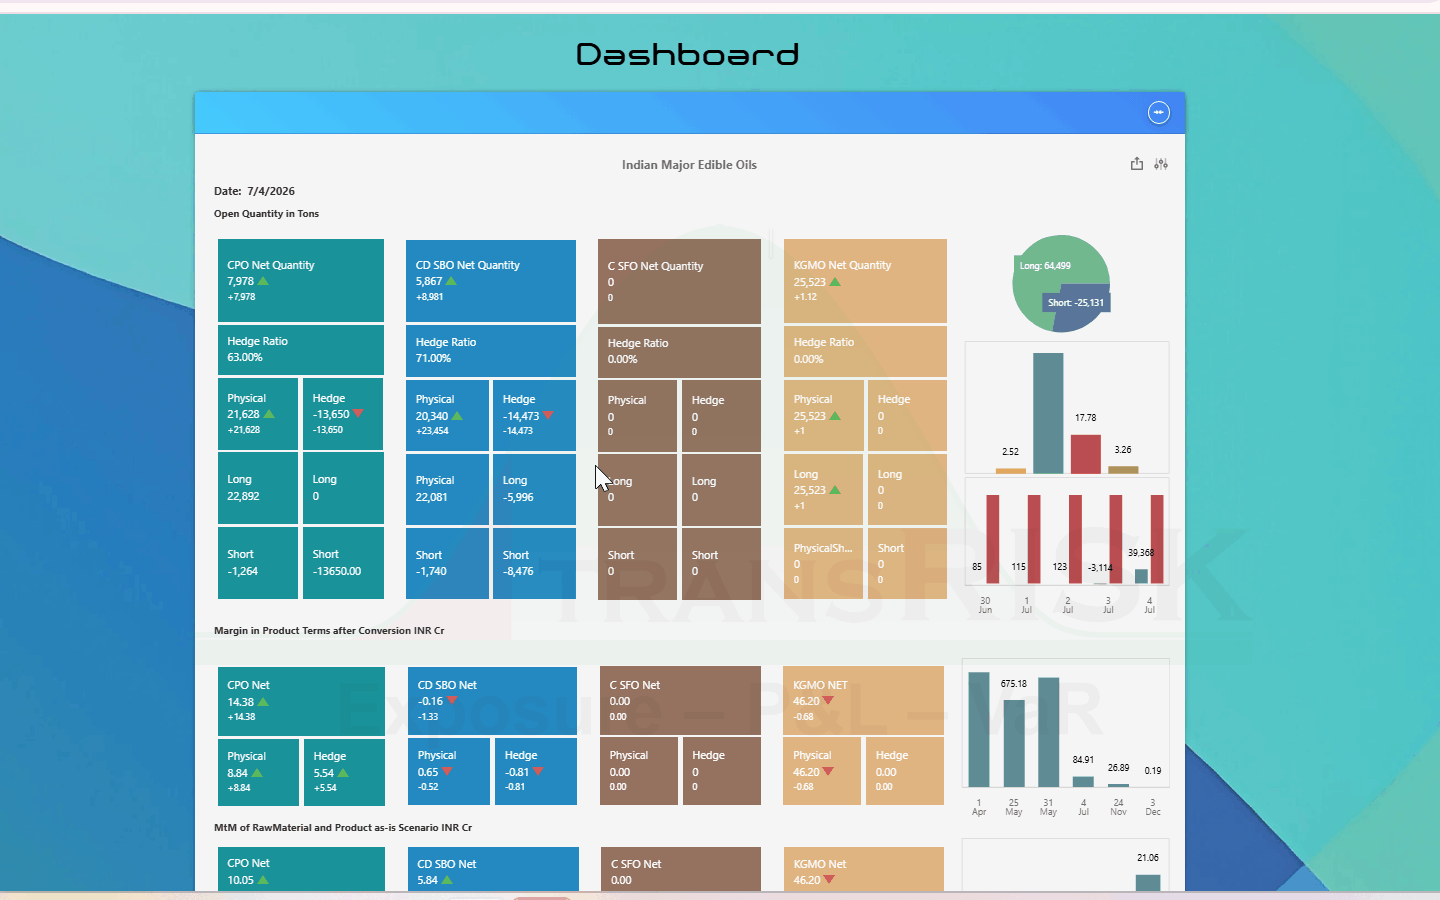
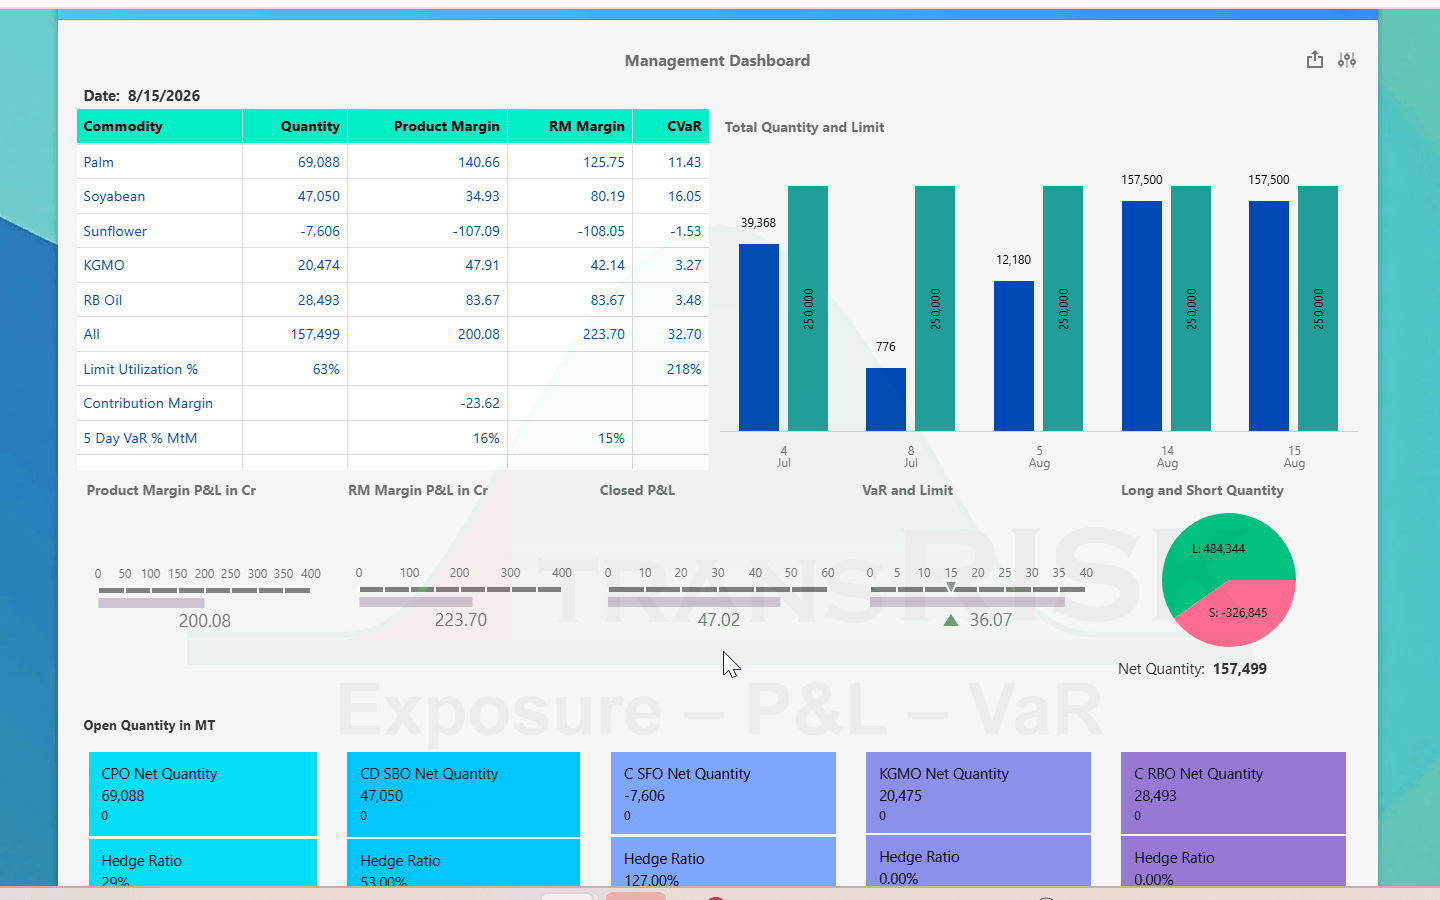
Executive cockpit — exposure, P&L, margin, VaR and limit utilisation in one screen Exposure, P&L, structural margins, risk analytics, limit governance, dashboards, and scenario simulation — in one system. No separate tools for different functions. No reconciliation between systems. One number, one source, one place for every team to work from.
-
Proactive scenario planning, not post-mortem reporting

Pre-trade assessment — portfolio VaR and limit utilisation before and after a proposed trade The most valuable risk analysis happens before a decision is made. TransRisk is built for pre-trade, pre-purchase, and pre-hedge analysis: what does this transaction do to my net exposure? How does it affect portfolio VaR? Does it push me toward a limit? Answered before the commitment, not explained after the loss.
-
Automated data integration that eliminates the morning consolidation cycle
Position data from ERP, broker statements, trading systems, and manual uploads is ingested automatically — validated, standardised, and consolidated before the first user arrives. The two-hour morning data preparation exercise that most commodity teams accept as unavoidable becomes unnecessary on day one.
-
Governance that runs itself
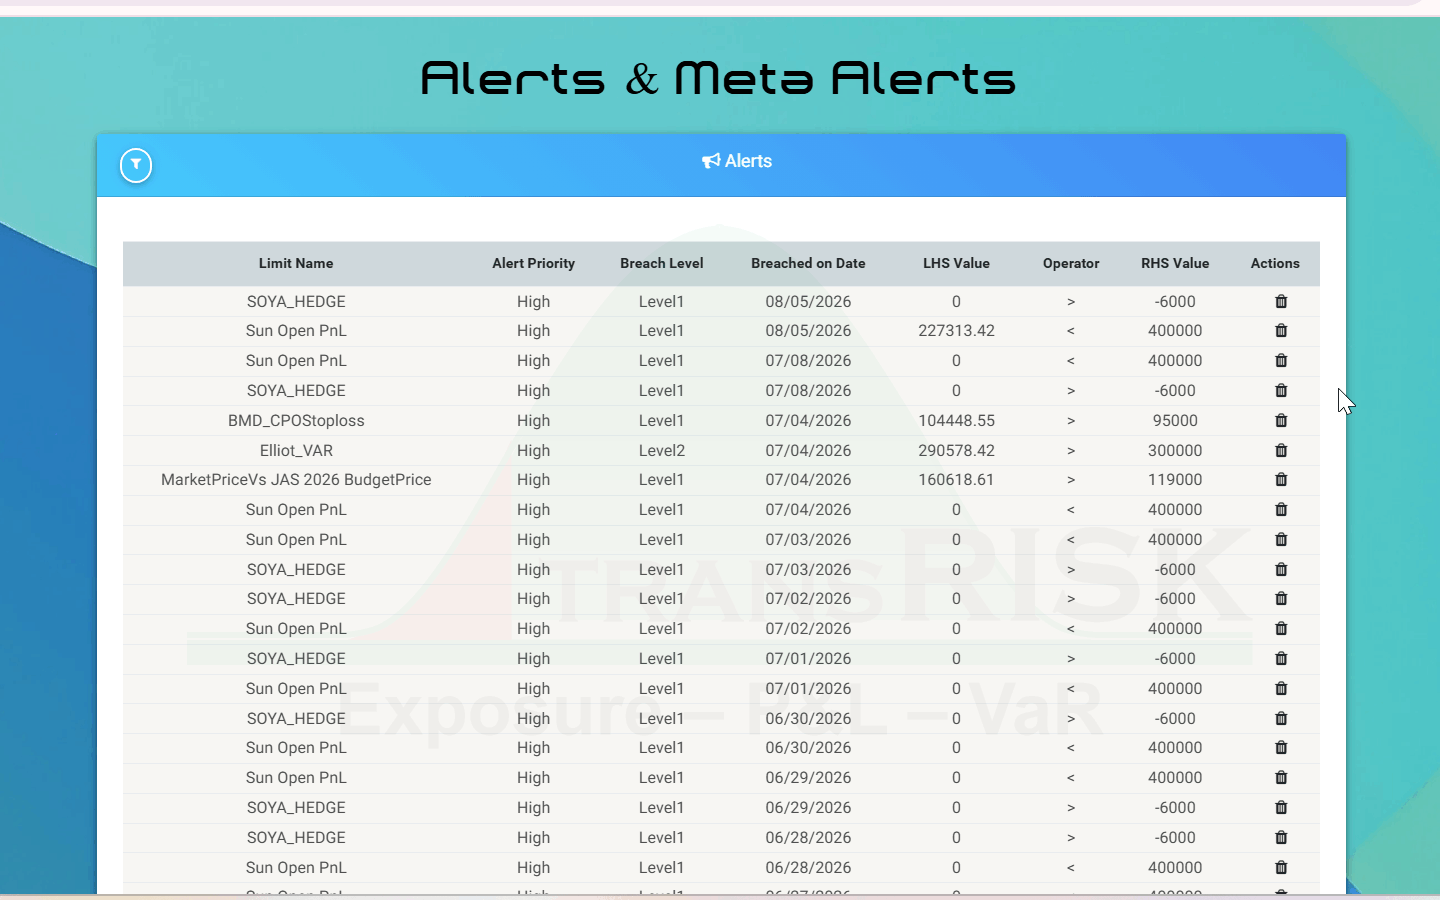
Breach notification — limit, breached value, percentage overshoot and responsible position Risk policy is encoded in the system as limits, thresholds, and alert rules. The system monitors compliance on every update — not when someone remembers to check. Breaches are caught before they escalate. The audit trail is maintained without anyone maintaining it manually. Policy enforcement is no longer a function of individual vigilance.
-
Enterprise-wide visibility that every function shares
Procurement, hedging, trading, finance, risk, and leadership all work from the same underlying position data — segmented to the level of detail relevant to each function, but never in conflict. The most common source of commodity P&L disputes is not a bad trade; it is three teams using different numbers and different definitions of net exposure. The CFO and the desk trader are looking at the same book, so "whose number is right?" stops being a weekly argument.
-
Capital efficiency through accurate net exposure
Hedging decisions based on an inaccurate net exposure produce inefficient hedge coverage. Over-hedging consumes premium and generates margin calls on unnecessary positions. Under-hedging leaves commercial exposure uncovered. TransRisk's accurate, automated net exposure means hedge sizing is based on the real book — producing better coverage at lower cost.
THE FULL COMPARISON
Spreadsheets, generic ERP modules and TransRisk — side by side.
Four of the asymmetries, below. The same dimensions across all three, with what each approach can and cannot do, are on a page of their own.
Four P&L measures, every morning
One measure, rebuilt by hand, ready midweek
Open MtM, Margin, Closed and Realised, automated daily
Positions arrive on their own
SAP extracts and broker statements copy-pasted
Native SAP integration and broker statement conversion
Breaches surface before they cost you
Found when somebody next opens the file
Automated alerts by trader, desk, commodity and market
A VaR number that survives scrutiny
No validation framework of any kind
Backtested on LME, CME, CBOT and NYMEX
The real cost of managing commodity risk manually.
The visible cost is time. The invisible costs are larger.
Decisions made on stale data.
By the time exposure data is consolidated from ERP, broker statements, and trading tools, the market has moved. Procurement decisions, hedge sizing, and risk assessments made on yesterday's numbers carry a hidden cost that never appears on a spreadsheet — but shows up in P&L.
Exposure that goes unmonitored because nobody has time to check it.
When limit monitoring depends on individual vigilance, the limits that most need watching are often the ones that receive least attention. The desk that is busiest is usually the one moving fastest toward a limit breach — and the least likely to be reviewing its own exposure.
Hedging decisions based on incomplete net exposure.
When the net exposure calculation is manual, it is approximated. A hedge sized against an approximation produces over-coverage in some positions and under-coverage in others. The cost of this inefficiency — excess hedge premium, margin calls on unnecessary positions, or unhedged exposure in the wrong places — is real and cumulative.
Governance that exists on paper but not in practice.
A risk policy checked monthly in a spreadsheet is not a risk policy — it is a compliance document that describes what should have happened. Without automated enforcement, policy drift is silent, gradual, and only visible after the fact.
THE FIRM BEHIND THE PLATFORM

You are not buying software.
You are accessing two decades of commodity risk expertise.
TransGraph Consulting has advised commodity-exposed enterprises on price forecasting, hedge model design, procurement strategy, and risk policy since 2003. TransRisk is the software expression of that practice — shaped by two decades of client work across manufacturing, processing, trading, FMCG, metals, and agri industries in 28+ countries. Every calculation in the platform reflects a methodology that was tested in real operations before it was built into software.
Our risk consultants and software developers are the same team. When a new hedge structure emerges in the market, it is in TransRisk within months. When a client's risk policy changes, our consultants help reconfigure the platform to reflect it.
About TransGraph →FOR EVERY DECISION-MAKER
Why decision-makers choose TransRisk
The choice to implement a specialist commodity risk platform is not a technology decision. It is a decision about how the organisation manages one of its most significant financial risks.
The commodity P&L line is one of the most volatile and least transparent in the business. TransRisk replaces the end-of-month reconciliation with a daily, auditable, position-level view across four P&L measures. Board-level risk reporting becomes a daily capability rather than a quarterly effort.
Policy enforcement that depends on human memory is not enforcement — it is optimism. TransRisk automates the monitoring layer: limits are checked on every update, warnings fire early, breaches are notified immediately, and the audit trail is maintained without manual intervention.
Buying decisions made without margin visibility are made blind. TransRisk shows the structural margin a purchase at today's price locks in — using actual inventory costs, plant yields, and current forward sales — before the order is confirmed. Procurement becomes a margin management function.
A desk that does not know its limit headroom before it executes is a liability. TransRisk gives traders position visibility, pre-trade risk impact assessment, and limit utilisation monitoring — so every execution decision is made with the full risk picture already visible.
One company, one risk culture
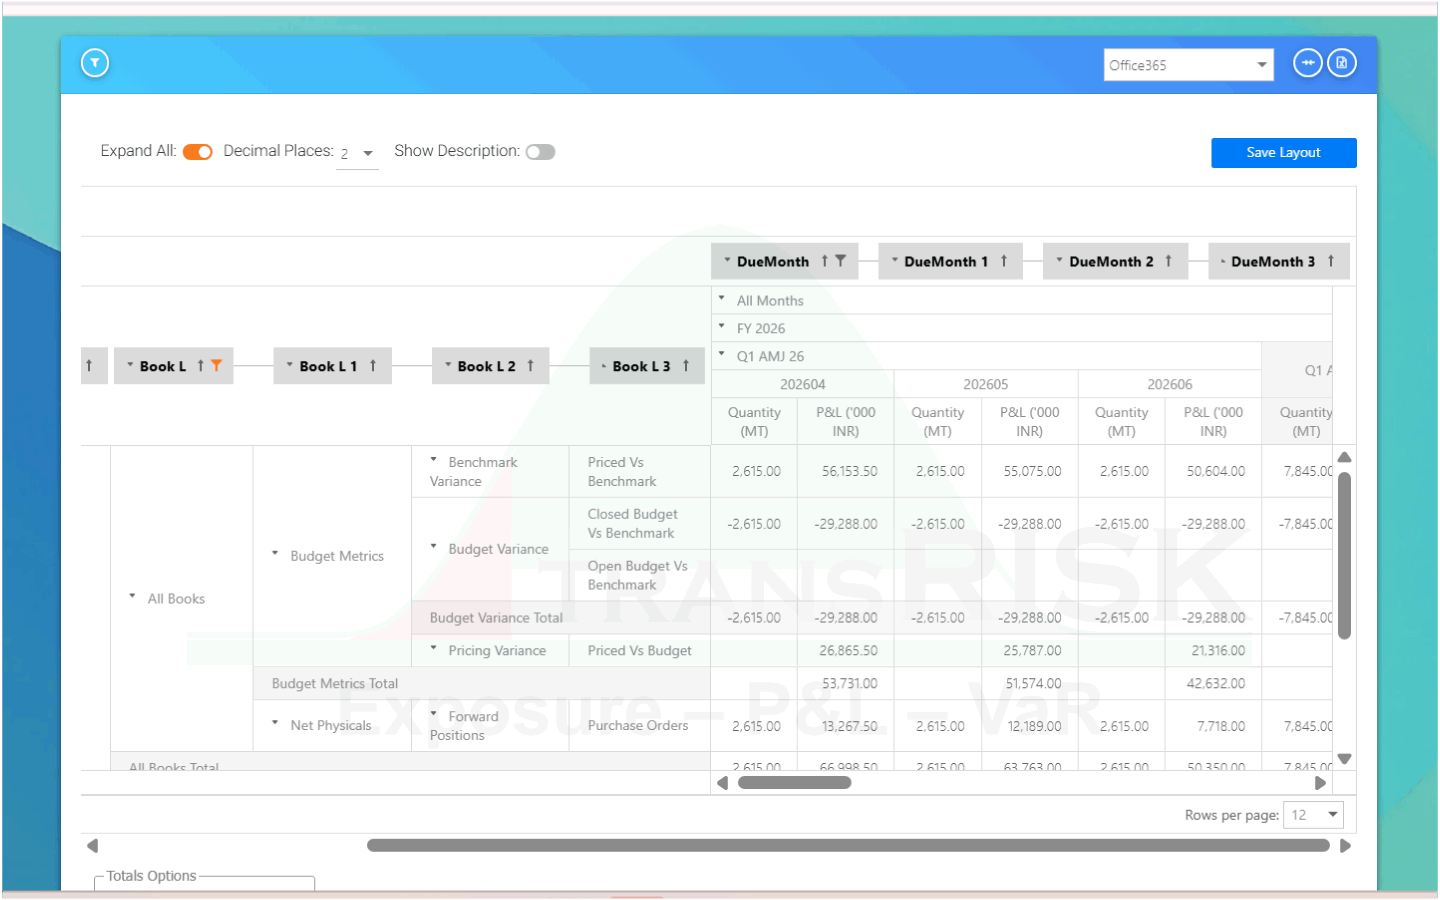
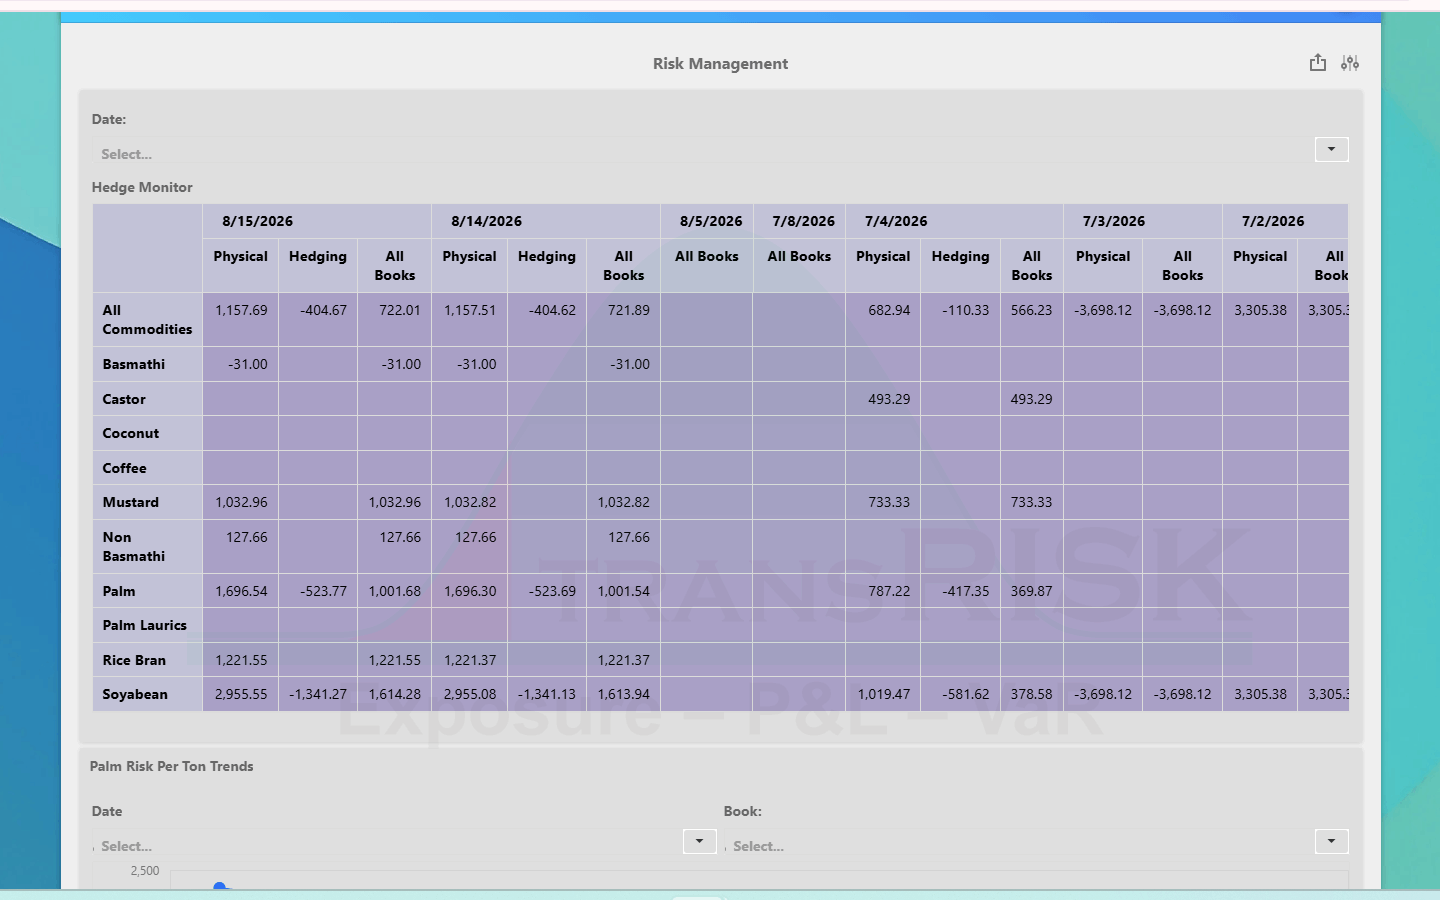
Consistent risk culture requires a shared system — one that every function works from, that applies the same rules to every position, and that gives every stakeholder a role-appropriate view of the same data. Traders see their positions and limits. Risk sees the full portfolio. The CFO sees the enterprise summary. Everyone is looking at the same underlying data.
One governed number
Across every function that touches the position
IN THEIR OWN WORDS
Heard from the teams that replaced their spreadsheets
-
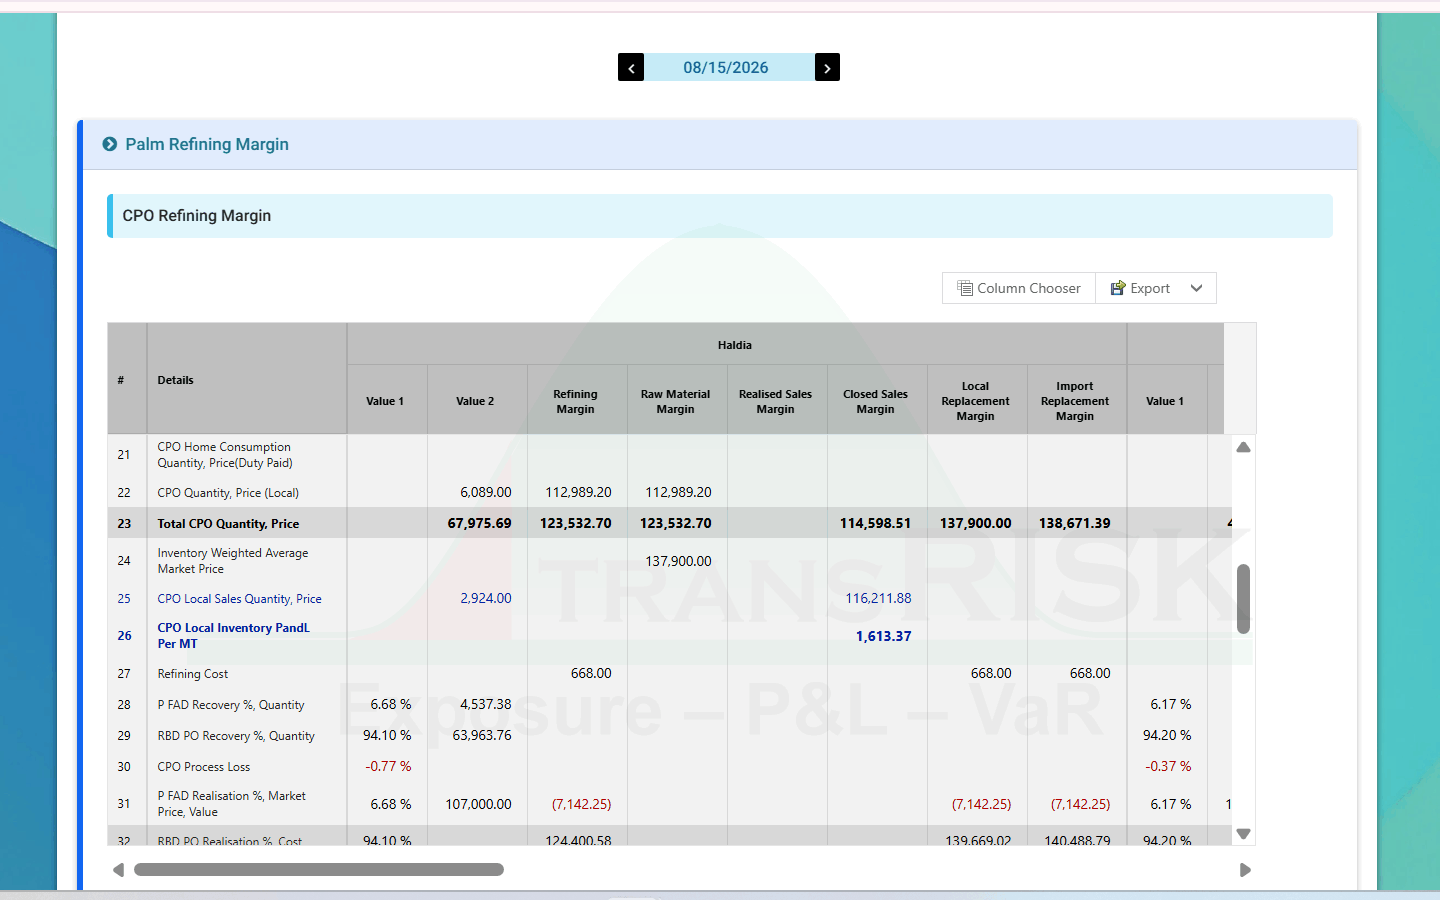
Vegetable oil market dynamics · Advisory partnership
We have engaged TransGraph as our partner in assessing vegetable oil market dynamics. TransGraph consulting has been instrumental in the journey and relationship we have built over the past 5 years. Insightful, analytical, and responsive are few qualities to name. We are pleased with the collaboration, dedication and consultation provided to us by TransGraph. It is great pleasure to work together with TransGraph and I wish them continued success.
CEO
Wings Group
-
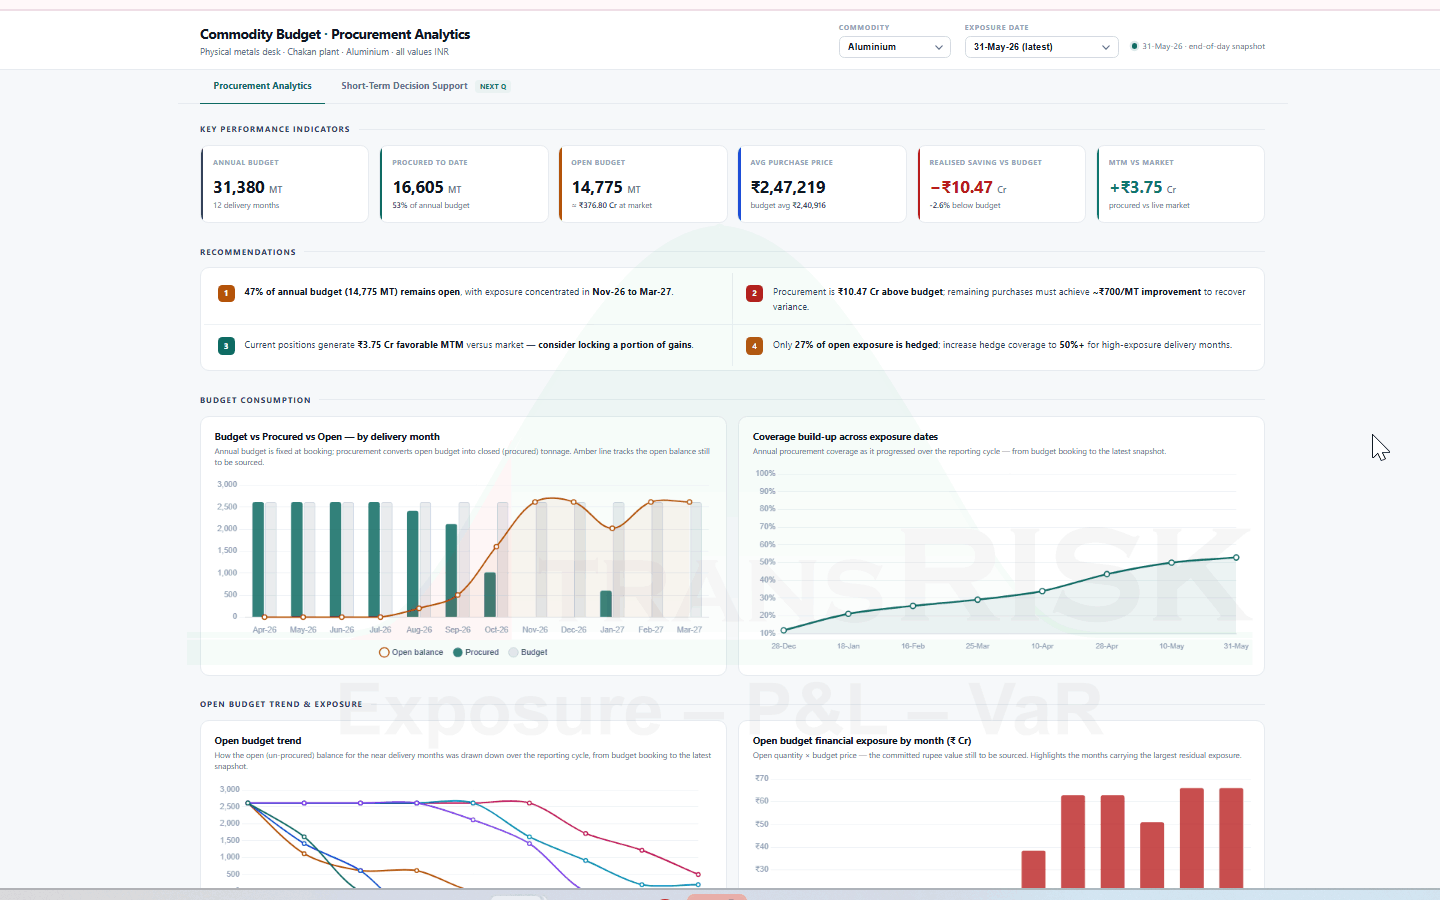
Procurement advisory · Aluminium price volatility
We have engaged TransGraph as our trusted Procurement and Risk Management Advisor for the past two years relying on their invaluable insights and data driven solutions to navigate the complexities of Aluminum Price volatility. Their prompt engagement and dedication to excellence have been the key factors in our successful Partnership.
Sr. Vice President
NCC Ltd
-
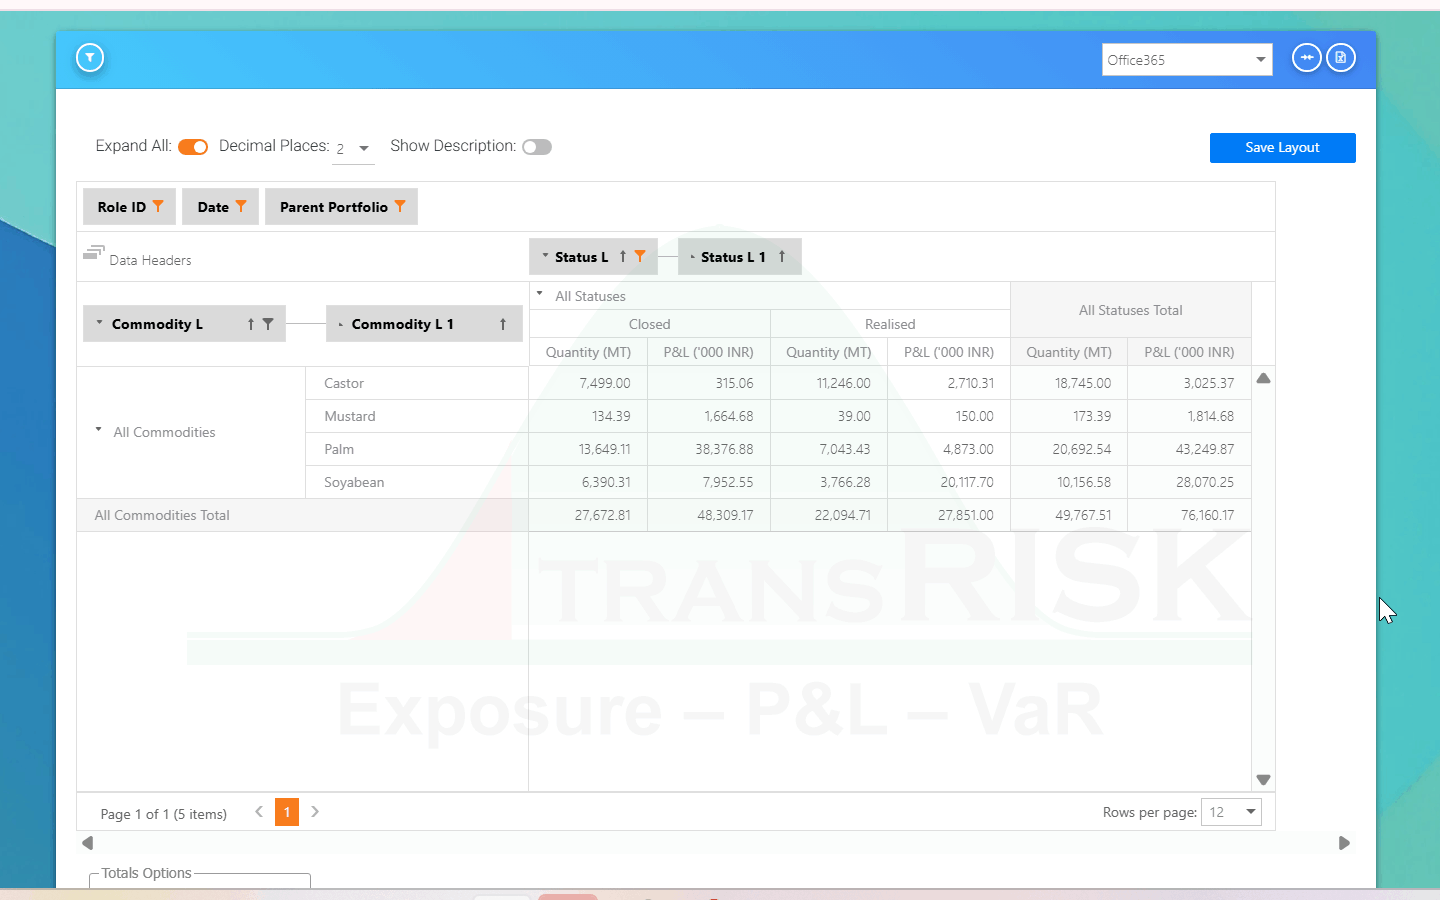
P&L and margin insight · Automated limits
TransRisk provides deeper insights into P&L, refining and replacement margins, and exposure for main commodities and by-products. The ability to convert broker statements into positions, simulate risk scenarios, and apply automated limits has enabled quicker and more transparent reporting at all levels.
Vice President
Top Edible Oil Trading Company in India
-
Support experience · Solution-oriented delivery
TransRisk has consistently provided a knowledgeable and hardworking team with strong functional and technical capabilities. Their promptness, professionalism, and solution-oriented approach have made the overall support experience highly dependable. The team is attentive to detail and works closely with us to develop practical, workable solutions to process-related challenges.
CRO
Indian Edible oil & FMCG Player
-
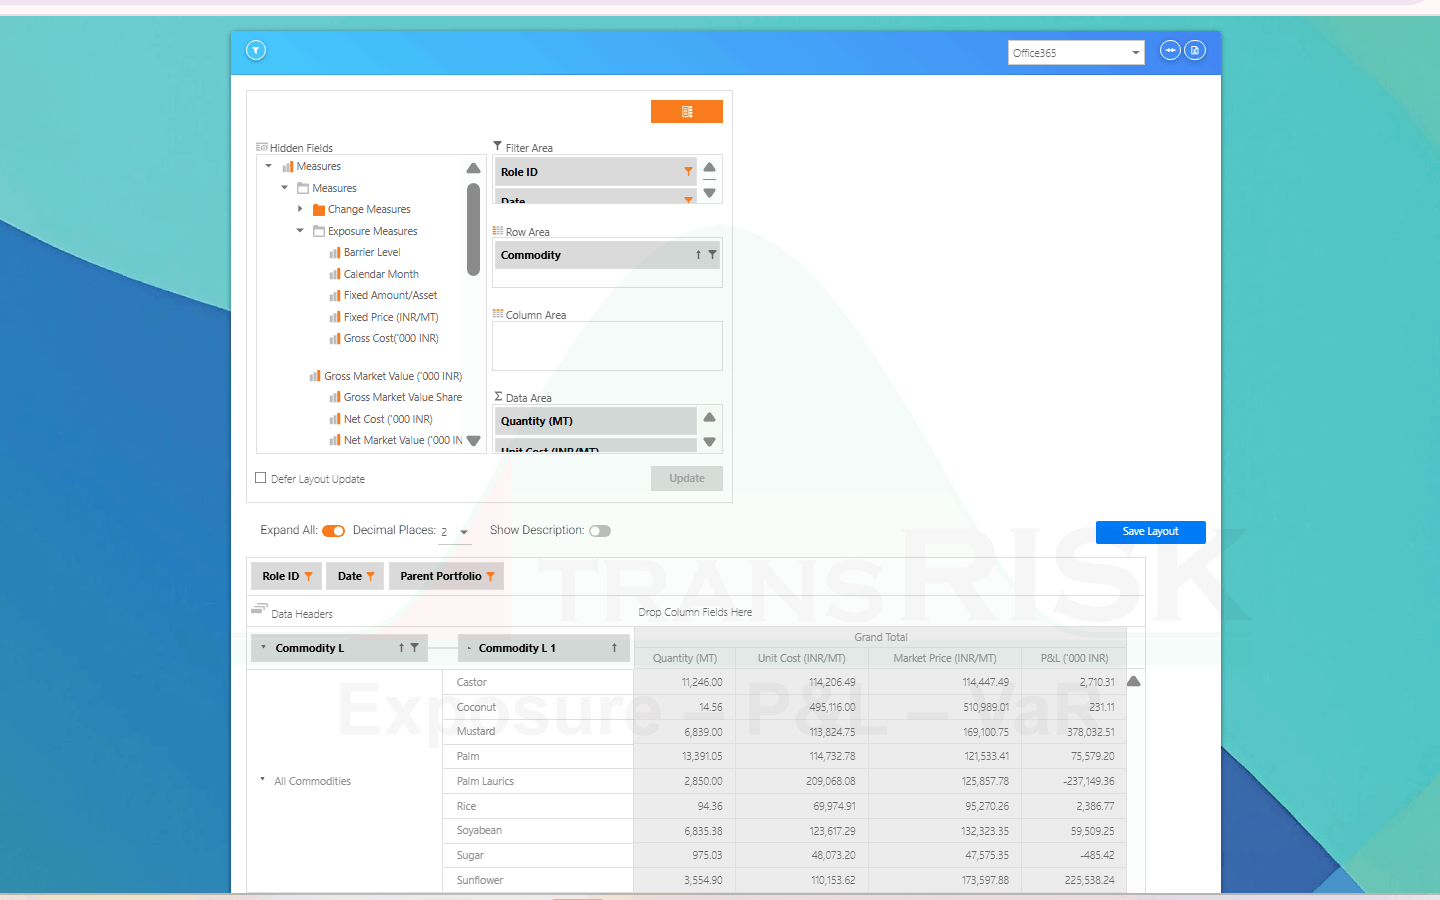
Delivery collaboration · Responsive support
Collaborating with the TransRisk team has been a highly effective and seamless experience. Their clear communication, professional approach, and well-organized workflow enabled us to align quickly on objectives and execute tasks efficiently. We sincerely appreciate the team’s responsiveness and professionalism, and look forward to working together again on future projects.
Risk and Reporting Head
Singapore-based Agri Trading and Manufacturing Group
-

Daily VaR processing · Responsive support
The team has been responsive and helpful with our daily VaR processing. Communication has been smooth, and issues are usually followed up and resolved promptly.
Risk Analyst
Multi Commodity Trading Desk
COMMON QUESTIONS
Questions commodity teams ask before switching
See the difference for yourself — configured to your commodity and your team.
Every demo is built around your industry, your commodities, and your current workflow. Not a generic walkthrough designed to impress rather than inform.
No commitment required Configured for your commodities Available for all industries